10-K: Annual report pursuant to Section 13 and 15(d)
Published on February 26, 2015
UNITED STATES
SECURITIES AND EXCHANGE COMMISSION
Washington, D.C. 20549
FORM 10-K
| (Mark One) | ||
|
ý |
ANNUAL REPORT PURSUANT TO SECTION 13 OR 15(d) OF THE SECURITIES EXCHANGE ACT OF 1934 |
|
|
For the fiscal year ended: December 31, 2014 |
||
|
or |
||
|
o |
TRANSITION REPORT PURSUANT TO SECTION 13 OR 15(d) OF THE SECURITIES EXCHANGE ACT OF 1934 |
|
Commission File Number: 001-33480
CLEAN ENERGY FUELS CORP.
(Exact name of registrant as specified in its charter)
|
Delaware (State or other jurisdiction of incorporation) |
33-0968580 (IRS Employer Identification No.) |
|
|
4675 MacArthur Court, Suite 800, Newport Beach, CA 92660 (Address of principal executive offices, including zip code) |
||
|
(949) 437-1000 (Registrant's telephone number, including area code) |
||
Securities registered pursuant to Section 12(b) of the Act:
| Title of each class | Name of each exchange on which registered | |
|---|---|---|
| Common Stock, par value $0.0001 per share | The NASDAQ Global Select Market |
Securities registered pursuant to section 12(g) of the Act: None
Indicate by check mark if the registrant is a well-known seasoned issuer, as defined in Rule 405 of the Securities Act. Yes o No ý
Indicate by check mark if the registrant is not required to file reports pursuant to Section 13 or Section 15(d) of the Act. Yes o No ý
Indicate by check mark whether the registrant (1) has filed all reports required to be filed by Section 13 or 15(d) of the Securities Exchange Act of 1934 during the preceding 12 months (or for such shorter period that the registrant was required to file such reports), and (2) has been subject to such filing requirements for the past 90 days. Yes ý No o
Indicate by check mark whether the registrant has submitted electronically and posted on its corporate Web site, if any, every Interactive Data File required to be submitted and posted pursuant to Rule 405 of Regulation S-T (§ 229.405 of this chapter) during the preceding 12 months (or for such shorter period that the registrant was required to submit and post such files). Yes ý No o
Indicate by check mark if disclosure of delinquent filers pursuant to Item 405 of Regulation S-K (§ 229.405 of this chapter) is not contained herein, and will not be contained, to the best of registrant's knowledge, in definitive proxy or information statements incorporated by reference in Part III of this Form 10-K or any amendment to this Form 10-K. o
Indicate by check mark whether the registrant is a large accelerated filer, an accelerated filer, a non-accelerated filer, or a smaller reporting company. See the definitions of "large accelerated filer," "accelerated filer," and "smaller reporting company" in Rule 12b-2 of the Exchange Act. (Check one):
| Large accelerated filer ý | Accelerated filer o |
Non-accelerated filer o (Do not check if a smaller reporting company) |
Smaller reporting company o |
Indicate by check mark whether the registrant is a shell company (as defined by Rule 12b-2 of the Act). Yes o No ý
The aggregate market value of the voting stock held by non-affiliates of the registrant as of June 30, 2014, the last business day of the registrant's second fiscal quarter, was approximately $773,993,465 (based on the closing price of the registrant's common stock as reported on such date by The NASDAQ Global Select Market). Shares of common stock held by officers and directors and holders of 10% or more of the outstanding common stock have been excluded from the calculation of this amount because such persons may be deemed to be affiliates. This determination of affiliate status is not necessarily a conclusive determination for other purposes.
As of February 19, 2015, the number of outstanding shares of the registrant's common stock was 90,363,353.
DOCUMENTS INCORPORATED BY REFERENCE
Portions of the registrant's proxy statement for the 2015 Annual Meeting of Stockholders are incorporated herein by reference in Part III of this annual report on Form 10-K to the extent stated herein.
Clean Energy Fuels Corp.
Annual Report on Form 10-K
For the Fiscal Year Ended December 31, 2014
TABLE OF CONTENTS
1
CAUTIONARY NOTE REGARDING FORWARD-LOOKING STATEMENTS
Certain statements in this annual report on Form 10-K may constitute "forward-looking statements" within the meaning of Section 27A of the Securities Act of 1933, as amended (the "Securities Act"), and Section 21E of the Securities Exchange Act of 1934, as amended (the "Exchange Act"). Forward-looking statements relate to future events or our future financial performance and are based upon our current assumptions, expectations and beliefs concerning future developments and their potential effect on our business. In some cases, you can identify forward-looking statements by the following words: "may," "will," "could," "would," "should," "expect," "intend," "plan," "anticipate," "believe," "estimate," "predict," "project," "forecast," "potential," "continue," "ongoing," or the negative of these terms or other comparable terminology, although the absence of these words does not necessarily mean that a statement is not forward-looking. We believe that the statements that we make in this annual report on Form 10-K regarding the following subject matters are forward-looking by their nature:
-
-
expected adoption of and growth in the market for natural gas as a vehicle fuel, and our ability to capture a substantial share of,
and enhance our leadership position within, this market when and if it expands;
-
-
the benefits of natural gas relative to gasoline and diesel and other alternative vehicle fuels;
-
-
future supply, demand, use and prices of crude oil and natural gas and fossil and alternative fuels, including gasoline, diesel,
natural gas, biodiesel, ethanol, electricity, and hydrogen;
-
-
our expectations regarding the market's perception of a need for alternative vehicle fuels generally, and anticipated market adoption
of natural gas as a preferred alternative to gasoline and diesel;
-
-
the impact of advancements in conventional fuels and other alternative vehicle fuels and technologies on our business;
-
-
the success of our America's Natural Gas Highway initiative;
-
-
development, commercial availability and adoption of new natural gas engines for the U.S. heavy-duty truck market, including the
Cummins Westport ISX 12G engine;
-
-
our expectations about the deployment of LNG and CNG heavy-duty trucks;
-
-
the rate of adoption of natural gas vehicles;
-
-
LNG sourcing and supply;
-
-
the success and importance of acquisitions, partnerships and other strategic relationships with third parties;
-
-
plans to build two LNG plants with GE;
-
-
plans to sell RNG we generate and purchase from third party producers as a vehicle fuel;
-
-
our ability to generate and sell RINs and LCFS Credits at prices that enable us to profitably market and sell RNG;
-
-
plans to expand our station network and business with existing customers and to win business with new customers;
-
-
the potential for oil companies, natural gas utilities, fuel retailers and others to enter the natural gas fuel market;
-
- the success of our business of manufacturing and selling natural gas vehicle fuel compression equipment;
2
-
-
the success of our business of producing and selling RNG;
-
-
our ability to sell RNG we produce at prices that are at a premium to conventional natural gas prices;
-
-
the success of our efforts to expand our CNG business, through our acquisition of NG Advantage and otherwise;
-
-
our future CNG compressor needs;
-
-
our ability to manage IMW's existing international operations;
-
-
the existence of and our plans to participate in and eligibility for state and federal regulations, programs, incentives and grant
programs that promote the use of cleaner burning fuels;
-
-
the impact and availability of federal tax attributes, credits and incentives on our business;
-
-
expansion of our California LNG plant;
-
-
strategic benefits of owning IMW, NG Advantage and our other subsidiaries;
-
-
more stringent emissions requirements continuing to make natural gas vehicles an attractive alternative to traditional gasoline and
diesel powered vehicles;
-
-
impact of environmental regulations and pressures on oil and natural gas supply;
-
-
the availability and cost of crude oil, gasoline, diesel and natural gas engines;
-
-
estimated incremental costs, annual fuel usage, fuel costs, and annual fuel cost savings for vehicles using natural gas instead of
gasoline or diesel;
-
-
projected capital expenditures, project development costs and related funding requirements;
-
-
our ability to estimate our LNG supply needs in light of our minimum commitment "take-or-pay" supply contracts;
-
-
access to equity capital and debt financing options, including, but not limited to, equipment financing, sale of convertible or
non-convertible promissory notes or commercial bank financing;
-
-
the potential for a single large stockholder to exert significant influence over our corporate decisions; and
-
- our expectations regarding our cash balances.
The preceding list is not intended to be an exhaustive list of all of our forward-looking statements. Although the forward-looking statements in this annual report on Form 10-K reflect our good faith judgment, based on currently available information, they involve known and unknown risks, uncertainties and other factors that may cause our actual results or our industry's actual results, levels of activity, performance, or achievements to be materially different from any future results, levels of activity, performance, or achievements expressed or implied by these forward-looking statements. Factors that might cause or contribute to such differences include, but are not limited to, those discussed in the "Risk Factors" section of this annual report on Form 10-K. As a result of these and other potential risk factors, the forward-looking statements in this annual report on Form 10-K may not prove to be accurate. All forward-looking statements in this annual report on Form 10-K are made only as of the date of this document and, except as required by law, we undertake no obligation to update publicly any forward-looking statements for any reason after the date we file this annual report on Form 10-K with the Securities and Exchange Commission, or to conform these statements to actual results or to changes in our expectations. You should, however, review the factors and risks we describe in the reports we will file from time to time with the Securities and Exchange Commission after the date we file this annual report on Form 10-K.
Unless the context indicates otherwise, all references to "Clean Energy," the "Company," "we," "us," or "our" in this annual report on Form 10-K refer to Clean Energy Fuels Corp., together with its majority and wholly owned subsidiaries.
3
Overview
We are the leading provider of natural gas as an alternative fuel for vehicle fleets in the United States and Canada, based on the number of stations operated and the amount of gasoline gallon equivalents ("GGEs") of compressed natural gas ("CNG") and liquefied natural gas ("LNG") delivered. We design, build, operate and maintain fueling stations and supply our customers with CNG fuel for light, medium and heavy-duty vehicles and LNG fuel for medium and heavy-duty vehicles. We also manufacture, sell and service non-lubricated natural gas fueling compressors and other equipment used in CNG stations and LNG stations, provide operation and maintenance ("O&M") services to customers, offer assessment, design and modification solutions to provide operators with code-compliant service and maintenance facilities for natural gas vehicle fleets, transport and sell CNG to large industrial and institutional energy users who do not have direct access to natural gas pipelines, process and sell renewable natural gas ("RNG"), which can be used as vehicle fuel or sold for renewable power generation, sell tradable credits we generate by selling natural gas and RNG as a vehicle fuel, including credits we generate under the California Low Carbon Fuel Standard ("LCFS Credits") and Renewable Identification Numbers ("RIN Credits" or "RINs") we generate under the federal Renewable Fuel Standard ("RFS") Phase 2, and help our customers acquire and finance natural gas vehicles and obtain local, state and federal grants and incentives.
CNG and LNG are cheaper and cleaner than gasoline and diesel fuel and are well -suited for use by vehicle fleets that consume high volumes of fuel, refuel at centralized locations or along well defined routes, and are increasingly required to reduce emissions. According to the U.S. Department of Energy's Energy Information Administration ("EIA"), the amount of natural gas consumed in the U.S. for vehicle use more than doubled between 2000 and 2014. We believe we are positioned to capture a substantial share of the anticipated future growth in the use of natural gas as a vehicle fuel in the U.S. given our leading market share and the comprehensive solutions we offer.
We sell natural gas vehicle fuels in the forms of CNG, LNG and RNG. CNG is produced from natural gas that is supplied by local utilities and third-party marketers to CNG vehicle fueling stations, where it is compressed and dispensed into vehicles in gaseous form. We also provide CNG via trailers in its compressed form directly from the fueling station and by delivering and vaporizing LNG to turn liquefied natural gas into compressed natural gas, in each case at locations where no gas pipeline service exists or gas pipeline pressures are inadequate. LNG is natural gas that is cooled at a liquefaction facility to approximately 260 degrees Fahrenheit until it condenses into a liquid, which takes up about 1/600th of its original volume as a gas. We deliver LNG to fueling stations via our fleet of 84 tanker trailers. At the stations, LNG is stored in above -ground tanks until dispensed into vehicles in liquid form. RNG is produced from waste streams such as landfills, animal waste digesters and waste water treatment plants. RNG production plants are connected to natural gas pipelines, which allow RNG to be transported to vehicle fueling stations, where it can be compressed and dispensed as CNG, and to LNG liquefaction facilities, where it is converted to LNG.
We serve fleet vehicle operators in a variety of markets, including heavy-duty trucks, airports, taxis, refuse hauling, fleet services, ready mix and public transit. We believe these fleet markets will continue to present a high growth opportunity for natural gas vehicle fuels for the foreseeable future. At December 31, 2014, we served approximately 943 fleet customers operating approximately 40,814 natural gas vehicles, and we owned, operated or supplied over 545 natural gas fueling stations in 42 states, and in British Columbia and Ontario within Canada.
4
2014 Business Developments
The key business developments that occurred in 2014 include the following:
-
-
We delivered 265.1 million GGEs of CNG, LNG and RNG, a 24% increase over the 214.4 million GGEs of CNG, LNG and RNG we
delivered in 2013.
-
-
We acquired a majority interest in and purchased a CNG station from NG Advantage, LLC ("NG Advantage"), a company engaged in
the business of transporting and selling CNG in high-capacity trailers to large industrial and institutional energy users, such as hospitals, food processors, manufacturers and paper mills, which do
not have direct access to natural gas pipelines.
-
-
We completed construction of 62 natural gas fueling stations; since 2008, we have built over 350 stations.
-
-
We formed a joint venture with Mansfield Energy Corp. ("Mansfield"), called Mansfield Clean Energy Partners LLC ("MCEP"), which
will provide natural gas fueling solutions to bulk fuel haulers in the U.S. MCEP's first customer is Mansfield Oil Company, one of the nation's largest providers of transportation fuel, whose fleet of
CNG trucks is fueling at a new Atlanta, Georgia, area public natural gas station built by MCEP and an affiliate of Mansfield, and opened in November 2014. MCEP expects to develop additional
public-access natural gas fueling stations throughout the U.S.
-
-
We sold our 70% interest in our former RNG extraction and processing plant located at the McCommas Bluff landfill in Dallas, Texas. We
continue to have the right to market and sell biomethane produced at the facility under our Redeem RNG vehicle fuel brand.
-
- We distributed 20.3 million GGEs of our Redeem RNG vehicle fuel, a 39% increase over 2013. Redeem is up to 88% cleaner than diesel and is 100% renewable.
Market for Natural Gas as an Alternative Fuel for Vehicles
As of December 2014, Natural Gas Vehicles for America ("NGV America") estimates that there were approximately 1,600 natural gas fueling stations in the United States and about 150,000 natural gas vehicles on American roads, including 37,000 heavy-duty vehicles (e.g. tractors, refuse trucks and buses), 25,000 medium-duty vehicles (e.g. delivery vans and shuttles) and 88,000 light-duty vehicles (e.g. passer cars, small utility vehicles, trucks and vans), and independent studies predict that natural gas vehicles will capture an increasing share of the medium- and heavy-duty vehicle market in future periods. For example, ACT Research recently produced a base-case forecast indicating that sales of natural gas heavy-duty trucks and buses will constitute 5% of the market in 2015, growing to 10% in 2018, 23% in 2020 and 35% in 2035.
We believe that natural gas is an attractive alternative to gasoline and diesel for use as a vehicle fuel in the United States because it is plentiful and domestically produced and cheaper and cleaner than gasoline or diesel. Since 2009, oil, gasoline, and diesel prices have been highly volatile, while natural gas prices have been relatively stable and lower than the cost of oil, gasoline and diesel on an energy equivalent basis. We also expect increasingly stringent federal, state and local air quality regulations, expanding initiatives by fleet operators to lower greenhouse gas emissions and increase fuel diversity, and additional regulations mandating low carbon fuels, all of which would support increased market adoption of natural gas as an alternative to gasoline and diesel. We believe all of the foregoing will support the development of an increased market opportunity for natural gas as a vehicle fuel in the United States.
5
Benefits of Natural Gas Fuel
Domestic and plentiful supply. Technological advances in natural gas drilling and production, including the widespread deployment of horizontal drilling techniques, the use of hydraulic fracturing (also known as "fracking") and multi-pad drilling (where wells are drilled at close proximity to each other on the surface before branching out underground), have unlocked vast natural gas reserves. The U.S. is now the number one producer of natural gas in the world, with proven, abundant and growing reserves of natural gas. We believe estimates of available natural gas reserves in the U.S. could continue to grow and we believe continued advances in drilling and production techniques could increase the accessibility of these reserves at reasonable costs, although there have been recent efforts to place new regulatory requirements on producing, transporting and dispensing natural gas which, if implemented, could make it more expensive or unprofitable to produce natural gas and could lead to reduced natural gas supply and increased natural gas prices.
Less Expensive. Due to the abundance of natural gas, the cost of natural gas in the U.S. is less than the cost of crude oil, on an energy equivalent basis. For example, at the end of 2014, oil was approximately three times more expensive than natural gas on an energy equivalent basis. This means that a GGE of natural gas is less expensive than a gallon of diesel or gasoline. Based on projections from the EIA, we believe that natural gas will remain cheaper than gasoline and diesel for the foreseeable future. In addition, because the price of the natural gas commodity makes up a smaller portion of the cost of a GGE of CNG or LNG, relative to the diesel or gasoline commodity portion of the cost of a gallon of diesel or gasoline, the price of a GGE of CNG or LNG is less sensitive to increases in the underlying commodity cost.
Cleaner. Natural gas contains less carbon than any other fossil fuel and thus produces fewer carbon dioxide emissions when burned. The California Air Resources Board ("CARB") has concluded that a natural vehicle emits 20% to 29% fewer greenhouse gas ("GHG") emissions than a comparable gasoline or diesel fueled vehicle on a well-to-wheel basis. Additionally, a study from Argonne National Laboratory, a research laboratory operated by the University of Chicago for the U.S. Department of Energy, indicates that natural gas vehicles produce at least 13% to 21% fewer GHG emissions than comparable gasoline and diesel vehicles.
For natural gas vehicles that run on RNG, it is estimated that the GHG emissions reduction is up to 88% compared to gas and diesel fueled counterparts. We sell RNG we produce and purchase from third parties through our extensive natural gas fueling infrastructure under the brand name Redeem. We plan to escalate our activities in this area.
Safety. As reported by NGV America, CNG and LNG are safer than gasoline and diesel because they dissipate into the air when spilled or in the event of a vehicle accident. When released, CNG and LNG are also less combustible than gasoline or diesel because they ignite only at relatively high temperatures. The fuel tanks and systems used in natural gas vehicles are subjected to a number of federally required safety tests, such as fire, environmental hazard tests, burst pressures, and crash testing, according to the U.S. Department of Transportation National Highway Traffic Safety Administration. Additionally, CNG and LNG are stored in above ground tanks and therefore cannot contaminate soil or groundwater.
Natural Gas Vehicles
Natural gas vehicles use internal combustion engines similar to those used in gasoline or diesel powered vehicles. A natural gas vehicle uses sealed storage cylinders to hold CNG or LNG, specially designed fuel lines to deliver natural gas to the engine, and an engine tuned to run on natural gas. Natural gas fuels have higher octane content than gasoline or diesel, and the acceleration and other performance characteristics of natural gas vehicles are similar to those of gasoline or diesel powered
6
vehicles of the same weight and engine class. Natural gas vehicles, whether they run on CNG or LNG, are refueled using a hose and nozzle that makes an airtight seal with the vehicle's gas tank. For heavy-duty vehicles, spark ignited natural gas vehicles generally operate more quietly than diesel powered vehicles. Natural gas vehicles typically cost more than gasoline or diesel powered vehicles, primarily due to the higher cost of the storage systems that hold the CNG or LNG.
Virtually any car, truck, bus or other vehicle is capable of being manufactured or modified to run on natural gas. Approximately 50 different manufacturers in the U.S. produce 100 models of heavy-, medium-, and light-duty natural gas vehicles and engines. These vehicles include long-haul tractors, refuse trucks, regional tractors, transit buses, cement trucks, delivery trucks, vocational work trucks, school buses, shuttles, passenger sedans, pickup trucks, and cargo and passenger vans. We expect that additional models and types of natural gas vehicles will become available if natural gas is increasingly adopted as a vehicle fuel in the U.S.
Products and Services
As of December 31, 2014, we owned, operated or supplied over 545 fueling stations for our customers in 42 states and Canada. We owned 256 of the stations, including 12 co-owned stations, and our customers owned the other 289 stations. We sell CNG, LNG and RNG and provide O&M services to our customers. For the year ended December 31, 2014, CNG and RNG (together) represented 73% and LNG represented 27% of our natural gas sales (on a GGE basis). We design and construct CNG and LNG fueling stations and sell or lease some of those stations to our customers. We also offer assessment, design and modification solutions to provide operators with code-compliant maintenance and service facilities for natural gas vehicle fleets. Through our NG Advantage subsidiary, we transport and sell CNG to large institutional and industrial energy users who do not have access to natural gas pipelines; we sell RNG produced by our subsidiary Clean Energy Renewable Fuels, LLC ("CERF"); and we manufacture and sell non-lubricated natural gas fueling compressors and related equipment and maintenance services through our subsidiary Clean Energy Compression Corp, also known as I.M.W. Industries Ltd. ("IMW"). In addition, we help our customers acquire and finance natural gas vehicles. We also generate and sell RIN Credits and LCFS Credits and receive certain federal fuel tax credits.
CNG Sales. We sell CNG through fueling stations and by transporting it to customers that do not have direct access to a natural gas pipeline. CNG fueling station sales are made through stations located on our customers' properties and through our network of public access fueling stations. At these CNG fueling stations, we procure natural gas from local utilities or third-party marketers under standard, floating-rate arrangements and then compress and dispense it into our customers' vehicles. Our CNG fueling station sales are made primarily through contracts with our customers. Under these contracts, pricing is principally determined on an index-plus basis, which is calculated by adding a margin to the local index or utility price for natural gas. CNG sales revenues based on an index-plus methodology increase or decrease as a result of an increase or decrease in the price of natural gas. Our customers typically are billed monthly based on the volume of CNG sold at a station. The remainder of our CNG sales fueling station sales are on a per fill-up basis at prices we set at public access stations based on prevailing market conditions.
Additionally, our subsidiary, NG Advantage, uses a fleet of 45 trailers to deliver CNG to large institutions and industrial energy users, such as hospitals, food processors, manufacturers and paper mills, that do not have direct access to natural gas pipelines. Utilizing its fleet of high-capacity tube trailers, NG Advantage creates a "virtual natural gas pipeline" that allows large oil, diesel or propane users to take advantage of the cost savings and environmental benefits of natural gas. We anticipate that NG Advantage will need to purchase or lease additional trailers to transport CNG in support of its operations.
7
LNG Production and Sales. We obtain LNG from our own plants as well as through relationships with suppliers. We own and operate LNG liquefaction plants near Houston, Texas and Boron, California, which we call the "Pickens Plant" and the "Boron Plant," respectively. The Pickens Plant has the capacity to produce 35 million gallons of LNG per year and includes tanker trailer loading facilities and a 1.0 million gallon storage tank that can hold up to 840,000 usable gallons. The Boron Plant is capable of producing 60 million gallons of LNG per year and has tanker trailer loading facilities similar to the Pickens Plant and a 1.8 million gallon storage tank that can hold up to 1.5 million usable gallons.
We expect that we will need to secure additional sources of LNG. Therefore, we plan to expand the Boron Plant to increase its production capacity to 90 million gallons of LNG per year. Further, we have obtained a commitment from General Electric Capital Corporation ("GE") to partially finance our purchase of two LNG plants (the "GE Plants") from GE Oil & Gas, Inc., an affiliate of GE, upon our satisfaction of certain conditions. We expect that the GE Plants, if and when complete, would each be initially capable of producing up to 90 million gallons of LNG per year and would each be designed to expand production capability to up to 365 million gallons of LNG per year.
We sell LNG on a bulk basis to fleet customers, who often own and operate their fueling stations, and we also sell LNG to fleet and other customers at our public-access LNG stations. Further, we sell LNG for non-vehicle purposes, including to customers that use LNG in oil fields or for industrial applications or fuel storage. During 2014, we procured 44% of our LNG from third-party producers, and we produced the remainder of the LNG at the Pickens and Boron Plants. For LNG that we purchase from third parties, we have entered into "take or pay" contracts that require us to purchase minimum volumes of LNG at index-based rates. We expect to enter into additional purchase contracts with third-party LNG producers in the future, some of which may be "take or pay" contracts.
We deliver LNG via our fleet of 84 tanker trailers to fueling stations, where it is stored and dispensed in liquid form into vehicles. We typically own the tanker trailers and we contract with third parties to provide tractors and drivers. Each LNG tanker trailer is capable of carrying 10,000 gallons of LNG. We anticipate that we will need to purchase or lease additional tanker trailers to transport LNG, and that we will need to increase the number of third parties who provide us contract carrier services. We sell LNG through supply contracts that are priced on an index-plus basis. LNG sales revenues based on an index-plus methodology increase or decrease as a result of an increase or decrease in the price of natural gas. We also sell LNG on a per fill-up basis at prices we set at public access stations based on prevailing market conditions. LNG generally costs more than CNG, as LNG must be liquefied and transported, and the federal government imposes higher fuel taxes on LNG.
Operation and Maintenance. We perform O&M services for CNG and LNG stations. For these services, we generally charge a per-gallon fee based on the volume of fuel dispensed at the station. Most of the stations for which we provide O&M services are monitored from our centralized operations center, facilitating increased reliability and safety, as well as lower operating costs. This monitoring helps us to ensure the timely availability of fuel and to respond rapidly to any technical difficulties that may arise. As of December 31, 2014, we had an operations team of 253 employees, including 152 full-time employees dedicated to performing preventative maintenance and available to respond to service requests in 42 states and in Canada. In addition, we have 80 full-time employees dedicated to performing preventative maintenance on IMW's foreign installations in Bangladesh, Colombia, Peru and China.
Station Construction and Engineering. Since 2008, we have built 360 natural gas fueling stations, either serving as general contractor or supervising qualified third-party contractors, for ourselves or our customers. We acquired the additional stations we own that we did not build through acquisition of assets or businesses. We use a combination of custom designed and off-the-shelf equipment to build fueling stations. Equipment for a CNG station typically consists of dryers, compressors (including those
8
manufactured by IMW), dispensers and storage tanks (which hold a relatively small buffer amount of CNG). Equipment for a LNG station typically consists of storage tanks that hold 5,000 to 25,000 gallons of LNG, plus related dispensing equipment. We also offer assessment, design and modification solutions to provide operators with code- compliant maintenance service facilities for natural gas vehicle fleets, which can include the construction and sale of facility modifications, including our NGV Easy Bay system, a natural gas vapor leak barrier developed specifically for natural gas vehicle facilities.
Many of our fueling stations have separate public access areas for retail customers, which generally have the look, feel and dispensing rates of traditional gasoline and diesel fueling stations. LNG dispensing requires special training because of the extreme low temperatures of LNG.
RNG Production and Sales. We own a RNG production facility located at a Republic Services landfill in Canton, Michigan. This facility was completed in December 2012, and we have entered into a ten-year fixed-price sale contract for the majority of the RNG that we expect the facility to produce. We also own a RNG facility at a Republic Services landfill in North Shelby, Tennessee, that became operational in 2014. We are seeking to expand our RNG business by pursuing additional RNG production projects, either on our own or with project partners. We sell some of the RNG we produce, and expect to sell a significant amount of the RNG we produce at the facilities we plan to build, through our natural gas fueling infrastructure for use as a vehicle fuel. In addition, we purchase RNG from third party producers and sell that RNG for vehicle use through our fueling infrastructure. The RNG we distribute for vehicle use is distributed under the name Redeem.
Natural Gas Fueling Compressors. Our IMW subsidiary manufactures and services non-lubricated natural gas fueling compressors and related equipment for the global natural gas fueling market. IMW is headquartered near Vancouver, British Columbia, has an additional manufacturing facility near Shanghai, China, and has sales and service offices in Bangladesh, Colombia, Peru and the United States. IMW enables us to satisfy our internal compressor needs, since compressors are the most important piece of equipment for a CNG station. As the adoption of natural gas vehicles has increased our CNG station construction backlog and our compressor requirements have increased, and we believe our compressor needs will continue to increase. IMW also allows us to provide certain customers with a "factory direct" offering. Since some customers do not want our full suite of services and simply want a station that they can own and operate themselves, our compressor manufacturing business allows us to offer them a high quality and low cost "equipment only" solution.
Vehicle Acquisition and Finance. We offer vehicle finance services for some of our customers' purchases of natural gas vehicles. We loan to certain qualifying customers a portion, and on occasion up to 100%, of the purchase price of their natural gas vehicles. We may also lease natural gas vehicles to certain of our customers in the future. Where appropriate, we apply for and receive state and federal incentives associated with natural gas vehicle purchases and pass these benefits through to our customers. We may also secure vehicles to place with customers or pay deposits with respect to such vehicles prior to receiving a firm order from our customers, which we may be required to purchase if our customer fails to purchase the vehicle as anticipated.
VETC. From October 1, 2006 to December 31, 2014, we received a federal fuel tax credit ("VETC") of $0.50 per gasoline gallon equivalent of CNG and $0.50 per liquid gallon of LNG that we sold as vehicle fuel. Based on the service relationship with our customers, either we or our customers claimed the credit. The program providing for the VETC expired on December 31, 2014.
Sales of RINs and LCFS Credits. We generate LCFS Credits when we sell RNG and conventional natural gas for use as a vehicle fuel in California, and we generate RIN Credits when we sell RNG for use as a vehicle fuel in the U.S. We can sell these RIN Credits and LCFS Credits to third parties who need the credits to comply with federal and state requirements. We anticipate that we will generate and
9
sell increasing numbers of RIN Credits and LCFS Credits as we grow our business and sell increasing amounts of CNG, LNG and RNG for use as a vehicle fuel. The market for RIN Credits and LCFS Credits is volatile, and the prices for such credits may be subject to significant fluctuations. Further, the value of RIN Credits and LCFS Credits will be adversely affected by any changes to the state and federal programs under which such credits are generated and sold.
Sales and Marketing
We have sales representatives covering all of our major operating territories, including Alabama, Arizona, California, Colorado, Florida, Georgia, Illinois, Indiana, Kentucky, Massachusetts, Minnesota, Missouri, New Hampshire, New Jersey, New Mexico, New York, North Carolina, Ohio, Pennsylvania, Tennessee, Texas, Vermont, Virginia, and Washington in the U.S., in Toronto and Vancouver in Canada and in Bangladesh, Colombia, Peru and China. At December 31, 2014, we had 108 employees in sales and marketing, including 19 employees of IMW. As and to the extent our business grows and we enter new geographic markets, we intend to expand our sales and marketing team, primarily by adding specialized sales experts to focus on opportunities in targeted metropolitan areas and in locations where we have existing fueling infrastructure. We market primarily through our direct sales force, attendance at trade shows and participation in industry conferences and events. Our sales and marketing group works closely with federal, state and local government agencies to provide education on the value of natural gas as a vehicle fuel and to keep abreast of proposed and newly adopted regulations that affect our industry.
Key Markets and Customers
We target customers in a variety of markets, such as trucking, airports, taxis, refuse, public transit, industrial energy users and government fleets. During 2012, 2013 and 2014, approximately 33%, 19%, and 18% of our revenues, respectively, were derived from contracts with governmental entities such as municipal transit fleets. We do not depend on a single customer or a few customers, the loss of which would have a material adverse effect on us.
-
-
TruckingWe believe that heavy-duty trucking represents one of the
greatest opportunities for natural gas to be used as a vehicle fuel in the U.S. These heavy-duty high-mileage trucks consume significant amounts of fuel and can benefit from the lower cost of natural
gas. Many well-known shippers, manufacturers, retailers and other truck fleet operators have started to adopt natural gas fueled trucks to move their freight. Such companies include Frito-Lay, Lowes,
MillerCoors, Kroger, Seaboard, Owens Corning, P&G, Raven, Ruan, UPS, Dillon Transport, Saddle Creek, Modern Transport, Bimbo, Ryder and Anheuser Busch. To help facilitate the transition of trucking
fleets to natural gas, we are building America's Natural Gas Highway. Many of our existing ANGH stations were initially built to provide LNG; however, because operators are adopting LNG heavy-duty
trucks and CNG heavy-duty trucks, we designed such stations to be capable of dispensing both fuels. We have been investing, and expect to continue to invest, additional capital in our ANGH stations to
add CNG fueling. Many existing ANGH stations are located at Pilot Flying J Travel Centers, one of the largest truck fueling operators in the U.S. To help accelerate the adoption by heavy-duty truck
fleets of natural gas, we have partnered with GE's Transportation Finance business to make loans and leases, including fair market value leases, available to fleet operators. We have also negotiated
favorable CNG and LNG tank pricing from manufacturers, which we are passing along to our customers.
-
- AirportsMany U.S. airports face emissions challenges and are under regulatory directives and political pressure to reduce pollution, particularly as part of any expansion plans. Many of these airports already have adopted various strategies to address tailpipe emissions, including rental car and hotel shuttle consolidation. In order to reduce emissions levels further, many airports require or encourage service vehicle operators to switch their fleets to natural gas, including
10
-
-
Taxis and Paratransit VehiclesAccording to the Taxi, Limousine, and
Paratransit Association, there were approximately 6,300 companies operating 171,000 taxicabs in the United States in 2010. We believe that less than 2% of these vehicles are natural gas vehicles.
Because taxi fleets and Paratransit Vehicles travel many miles, use a relatively high volume of vehicle fuel and can refuel at a central location, we believe they could be very good candidates for use
of CNG. Natural gas vehicles have historically provided taxi fleets and paratransit operators a convenient way to reduce operating costs and provide a clean environment for their drivers and
customers. We serve over 1,500 taxis in Southern California, the San Francisco Bay Area, Dallas, Las Vegas, Ohio, Phoenix, Chicago, Connecticut and Seattle.
-
- Refuse HaulersAccording to INFORM, there are nearly 200,000 refuse trucks in the United States, consuming approximately two billion gallons of fuel per year, that collect and haul refuse and recyclables from collection points to landfills, transfer stations, waste-to-energy facilities, and material recovery facilities. Refuse haulers are increasingly adopting trucks that run on CNG to realize operating savings and to address their customers' demands for reduced emissions. We estimate that approximately 60% of the new refuse collection trucks ordered during 2014 were powered by CNG. Waste Management has announced that it plans to transition at least 90% of its fleet to natural gas vehicles. We serve numerous Waste Management sites, as well as Republic Services and other refuse haulers' sites, and we hope to expand these numbers in the future. In addition to Waste Management and Republic Services, we also have contracts with private waste haulers such as Atlas Disposal (CA), Blue Diamond Disposal (NJ), Burrtec (CA), Central Jersey Waste, Choice Waste (FL), CleanScapes (Seattle), V. Garofalo & Sons (NY), Homewood Disposal (IL), Mission Trail (CA), Livermore Sanitation (CA), USA Recycling (CT), Peoria Disposal (IL), Progressive Waste (LA and TX), Recology (Formerly Norcal Waste), South San Francisco Scavenger, Tidewater Chesapeake (VA), Waste Connection Vancouver and Waste Pro (FL), among others. We also provide vehicle fueling services to municipal refuse fleets, including fleets in Burbank (CA), Dallas (TX), Fresno (CA), Los Angeles (CA), Sacramento (CA), San Antonio (TX), El Paso (TX), Richmond (VA), Scottsdale (AZ), Mesa (AZ), Kansas City (MO), Atlantic Counties (NJ), Huntington (NY), Smithtown (NY) , Brookhaven (NY), Atlanta (GA), Lancaster (PA), and on Long Island, New York among other locations. We believe refuse companies are ideal customers because they can be served by centralized fueling infrastructure and they use a relatively high volume of fuel. We currently serve over 250 hauling companies.
airport delivery fleets, door-to-door and parking shuttles and taxis. To assist in this effort, airports are contracting with service providers to design, build and operate natural gas fueling stations in strategic locations on their properties. Airports we serve include Albuquerque, Atlanta Hartsfield Jackson International, Austin Bergstrom International, Baltimore Washington International, Burbank, Cleveland Hopkins International, Dallas-Ft. Worth International, Denver International, Dulles International Airport (Washington D.C.), George Bush International (Houston), Hartford, Las Vegas, Love Field (Dallas), Logan International Airport (Boston), Long Beach, LaGuardia (New York), John F. Kennedy International Airport (New York), Los Angeles International, New Orleans, Newark International, Oakland International, Ontario, Orlando, Palm Springs, Philadelphia International, Phoenix Sky Harbor International, Ronald Reagan Washington National, San Francisco International, Santa Ana/John Wayne, San Diego International, SeaTac International (Seattle), Tampa International, Tucson International and Will Rogers (Oklahoma City). At these airports, our representative customers include buses, delivery vehicles and taxi and van fleets, as well as parking and car rental shuttles. We believe these customers are well -suited for natural gas use because they use a relatively high volume of vehicle fuel and can be served by centralized fueling infrastructure. We believe that vehicles serving airports in the U.S., consume an aggregate of approximately two billion gallons of fuel per year.
11
-
-
Transit AgenciesAccording to the American Public Transportation
Association ("APTA"), there are over 67,250 municipal transit buses operating in the U.S. In many areas increasingly stringent emissions standards have limited the fueling options available to public
transit operators, making them well-suited for adoption of natural gas as a preferred vehicle fuel. Also, transit agencies typically fuel at a central location and use high volumes of fuel. We
estimate that the transit agencies in the U.S. consume an aggregate of approximately 1.5 billion gallons of fuel per year. Transit agencies were early adopters of natural gas vehicles, and more
than one third of agencies nationwide are operating part or all of their fleet on LNG or CNG, according to APTA. Our U.S. public transit customers include the following: in California, Los Angeles
Metropolitan Transit Authority, Foothill Transit, Long Beach Transit, Orange County Transit Authority, Santa Cruz Metropolitan, Santa Monica Big Blue Bus, OmniTrans San Bernardino, Commerce,
Montebello, Torrance, Elk Grove, Glendale, Santa Clarita and Santa Cruz. In the Southwest, Dallas Area Rapid Transit (TX), Sun Metro (El Paso, TX), El Metro (Laredo, TX), Phoenix Transit (AZ), Tempe
Transit (AZ), Regional Transportation Commission of Southern Nevada (Las Vegas) and the public agencies in Albuquerque and Santa Fe, New Mexico. In the Midwest, the public agencies in Kansas City (MO)
and Akron and Canton, Ohio; and on the East Coast, Bucks County (PA), Hillsborough Area Regional Transit (Tampa, FL) and NICE Bus (Long Island, NY). We also serve public transit customers in British
Columbia.
-
-
Government FleetsAccording to the Federal Highway Administration ("FHA"),
in 2011, there were approximately 4.0 million government fleet vehicles in operation in the United States, including those operated by federal, state and municipal entities. In California and
Texas, for example, there were over 667,572 and 571,688 government vehicles, respectively, as of 2012, according to the FHA. As government regulations on pollution continue to become more stringent,
government agencies are evaluating ways to make their fleets cleaner and run more economically. Our representative government fleet customers include the California Department of Transportation (Los
Angeles and Orange County), State of New York, State of Colorado, City of New York, City of Richmond (VA), City of Hartford (CT), City of Kansas City (MO), Lee's Summit School District (MO), City of
Newark (NJ), City of Atlantic City (NJ), City of Columbia (MO), City of Mesa (AZ), City of Scottsdale (AZ), City of Denver (CO), City and County of Los Angeles (CA), City of Chula Vista (CA), City of
Newport Beach (CA), South Coast Air Quality Management District (CA), City of Long Beach (CA), County of Maricopa (AZ), City of San Antonio (TX), City of El Paso (TX), Town of Smithtown (NY), City and
County of San Francisco (CA), City of Oakland (CA), City and County of Dallas (TX), City of Phoenix (AZ), The University of California, and Oklahoma State University.
-
- Industrial CustomersFounded in 2011 and based in Vermont, NG Advantage delivers CNG as a less expensive substitute fuel source to large institutions and industrial facilities that do not have access to a natural gas pipeline. NG Advantage acts as a "virtual natural gas pipeline," using its fleet of 45 trailers to deliver CNG to these facilities for their use. NG Advantage customers utilize CNG to achieve lower energy costs and to reduce emissions. From its inception through 2014, NG Advantage focused on customers in New England and Eastern New York; in 2015, NG Advantage plans to expand beyond these geographic markets.
Corporate Information; Acquisitions and Divestitures
We were incorporated under the laws of the State of Delaware in April 2001. In August 2008, we acquired a 70% interest in a facility that collects, processes and sells RNG collected from a landfill in Dallas, Texas. In December 2014, we sold all of our interest in that facility to our project partner. In October 2009, we acquired BAF Technologies ("BAF"), a provider of natural gas vehicle conversions and design and engineering services for natural gas engine systems. In June 2013, we sold BAF to a subsidiary of Westport Innovations, Inc. In September 2010, we acquired the advanced, non-lubricated
12
natural gas fueling compressor and related equipment manufacturing and servicing business of IMW. We purchased Wyoming Northstar Incorporated and its affiliated entities (collectively, "Northstar"), a leading provider of station design, construction, operations and maintenance services in December 2010. In 2011, we acquired the natural gas fueling infrastructure construction business of Weaver Electric, Inc. In March 2013, we sold our interest in Clean Energy del Peru, a CNG provider located in Peru. In May 2013, we acquired Mansfield Gas Equipment Systems, a provider of CNG station design and construction and CNG equipment repair and maintenance services. In September 2014, we formed MCEP. In October 2014, we acquired a majority interest in and purchased a CNG station from NG Advantage. We anticipate pursuing additional acquisitions, divestitures, partnerships and investments as we become aware of opportunities that we believe we can increase our competitive advantages, expand our product offerings, take advantage of industry developments, or enhance our market position.
Tax Incentives
The program providing for the VETC federal fuel tax credit expired on December 31, 2014. However, U.S. federal and state government tax incentives and grant programs continue to be available to offset the cost of acquiring natural gas vehicles, convert vehicles to use natural gas or construct natural gas fueling stations.
Grant Programs
We apply for and help our fleet customers apply for federal, state and regional grant programs in states where we operate. These programs provide funding for natural gas vehicle conversions and purchases and natural gas fueling station construction.
Competition
The market for vehicular fuels is highly competitive. The biggest competition for CNG and LNG is gasoline and diesel, as the vast majority of vehicles in the U.S. and Canada are powered by gasoline and diesel. Many of the producers and sellers of gasoline and diesel fuels are large entities that have significantly greater resources than we have. We also compete with suppliers of other alternative vehicle fuels, including ethanol, biodiesel and hydrogen fuels, as well as providers of hybrid and electric vehicles. Further, for certain of our key customer markets, such as airports, taxis and paratransit vehicles, we indirectly compete with companies providing alternative transportation means that may limit these markets generally, such as Uber and Lyft.
A significant number of established businesses, including oil and gas companies, alternative vehicle and other alternative fuel companies, fuel providers, refuse collectors, natural gas utilities and their affiliates, truck stop and fuel station operators, industrial gas companies and other organizations have entered or are planning to enter the market for natural gas and other alternatives for use as vehicle fuels. Many of these current and potential competitors have substantially greater financial, marketing, research and other resources than we have. We believe we have approximately 100 competitors in the market for natural gas vehicle fuels, including:
-
-
Providers of CNG fuel infrastructure and fueling services, including Trillium, AmpCNG, EVO CNG, Questar Fueling, Gain Clean Fuels,
Constellation and TruStar Energy;
-
-
Travel-center operators, including Love's Travel Stops and Sapp Bros., who are adding CNG refueling infrastructure to their networks;
-
-
Fuel station owners, such as Kwik Trip, a company that owns CNG fueling stations in the Midwestern U.S.;
-
- Shell Oil Products U.S. and Blu/TransFuels, which operate LNG fueling stations; and
13
-
- Applied LNG Technology, Stabilis and Prometheus Energy, each of which distributes LNG.
Several natural gas utilities own and operate public access CNG stations that compete with our stations. In December 2012, the California Public Utilities Commission has approved a compression services tariff application by the Southern California Gas Company, allowing the utility to offer natural gas fueling infrastructure construction services that compete with our offerings. In January 2014, Northwest Natural was also granted a similar service tariff by the Oregon Public Utilities Commission. In addition, utilities in several other states, including Michigan, Illinois, New Jersey, North Carolina, Missouri, Maryland, Washington, Kentucky and Georgia, have made efforts to invest in or otherwise enter the market for natural gas vehicle fuels. Utilities have unique competitive advantages, including their typically lower cost of capital, substantial and predictable cash flows, long-standing customer relationships, greater brand awareness and large and well-trained sales and marketing organizations.
We manufacture and sell CNG fueling equipment through our IMW subsidiary. The market for CNG fueling equipment is highly competitive and our competitors include Aspro, GNC Galileo, GE, SAFE, ANGI Energy Systems, Inc., and Atlas Copco. Numerous other equipment or compressor manufacturing companies may also enter the market in the future. We also compete with many third parties for the rights to develop RNG production facilities, as well as for customers to purchase the RNG we produce. We sell CNG to large industrial and institutional energy users through our NG Advantage subsidiary and compete with other participants in this highly competitive market, including Xpress Natural Gas, OsComp Systems and Irving Ltd.
We compete for vehicle fuel users based on price, availability of vehicles that operate on natural gas, convenience and accessibility of our stations, quality, cleanliness and safety of our fuel, and brand recognition. As of December 31, 2014, we owned, operated or supplied 545 CNG and LNG fueling stations. Of these, we operate 371 CNG fueling stations, which we estimate is approximately four times the number of CNG fueling stations operated by our next largest competitor. We believe we are the only company in the U. S. or Canada that provides both CNG and LNG on a significant scale, and we operate in more states and provinces than any of our competitors. We expect, however, competition to intensify in the near term if and to the extent the demand for natural gas vehicle fuel and related equipment increases. Increased competition will lead to amplified pricing pressure, reduced operating margins and fewer expansion opportunities.
Government Regulation and Environmental Matters
Certain aspects of our operations are subject to regulation under federal, state, local and foreign laws. If we were to violate these laws or if the laws or enforcement proceedings were to change, it could have a material adverse effect on our business, financial condition and results of operations.
Regulations that significantly affect our operations are described below.
-
-
CNG and LNG stationsTo construct a CNG or LNG fueling station, we must
satisfy permitting and other requirements and either we or a third party contractor must be licensed as a general engineering contractor. The installation of each CNG and LNG fueling station must be
in accordance with federal, state and local regulations pertaining to station design, environmental health, accidental release prevention, above-ground storage tanks, hazardous waste and hazardous
materials. We are also required to register with certain state agencies as a retailer/wholesaler of CNG and LNG.
-
- Transfer of LNGFederal Safety Standards require each transfer of LNG to be conducted in accordance with specific written safety procedures. These procedures must be located at each place of transfer and must include provisions for personnel to be in constant attendance during all LNG transfer operations.
14
-
-
LNG liquefaction plantsTo build and operate LNG liquefaction plants, we
must apply for facility permits or licenses to address many factors, including storm water and wastewater discharges, waste handling and air emissions related to production activities or equipment
operations. The construction of LNG plants must also be approved by local planning boards and fire departments.
-
-
FinancingState agencies generally require the registration of finance
lenders. For example, in California, pursuant to the California Finance Lenders Law, one of our subsidiaries is a registered finance lender with the California Department of Corporations.
-
-
Natural gas fueling compressorsCNG fueling equipment is manufactured to
meet the electrical and mechanical design standards of the country where the equipment will be installed. Our manufacturing facility in Canada is registered with the British Columbia Safety Authority
and the Society of Mechanical Engineers for manufacturing and operating pressure vessels.
-
-
RNGOur RNG production facilities are required to comply with Title V of
the Clean Air Act air permits. In addition, our RNG projects must produce RNG that meets the gas quality specifications of the local utilities that accept the gas. These specifications are approved by
the relevant state utilities commission.
-
-
Federal RFSIn February 2010, the U.S. Environmental Protection Agency
("EPA") finalized the RFS (which were established by the Energy Policy Act of 1992/2005), which creates RINs that can be generated by production and use of RNG in the transportation sector and can be
sold to fuel providers that are not compliant under the RFS.
-
- California's AB 32California has adopted legislation, AB 32, which calls for a cap on greenhouse gas emissions throughout California and a statewide reduction to 1990 levels by 2020 and an additional 80% reduction below 1990 levels by 2050. Other states and the federal government are considering passing similar measures to regulate and reduce greenhouse gas emissions. Any of these regulations, when and if implemented, may regulate the greenhouse gas emissions produced by our LNG production plants, our CNG and LNG fueling stations or our RNG production facilities. To achieve California's greenhouse gas emissions reductions for mobile sources, in 2009, CARB approved the LCFS, which requires a 10% carbon reduction in gasoline and diesel fuels sold in the State of California by 2020, and therefore encourages other low carbon "compliant" transportation fuels (including CNG, LNG and RNG) to enter the marketplace by allowing them to generate LCFS Credits that can be sold to noncompliant regulated parties.
We believe we are in substantial compliance with environmental laws and regulations and other known regulatory requirements. Compliance with these regulations has not had a material effect on our capital expenditures, earnings or competitive position. More stringent environmental laws and regulations may be imposed in the future, such as more rigorous air emissions requirements, proposals to make waste materials subject to more stringent and costly handling, disposal and clean-up requirements or regulations of greenhouse gas emissions from our LNG production plants, our CNG and LNG fueling stations or our RNG production facilities. Accordingly, new laws or regulations or amendments to existing laws or regulations might require us to undertake significant capital expenditures, which may have a material adverse effect on our business, consolidated financial condition, results of operations and cash flows.
Employees
As of December 31, 2014, we employed 1,128 people, of whom 108 were in sales and marketing, 864 were in operations, engineering and compressor production, and 156 were in finance and
15
administration. We have not experienced any work stoppages and none of our employees is subject to collective bargaining agreements. We believe that our employee relations are good.
Financial Information about Segments and Geographic Areas
We operate our business in one reportable segment. For information about our revenues from external customers, operating income (loss) and long-lived assets broken down by geographic area, see note 14 to our consolidated financial statements included in this report. We are subject to certain risks attendant to our foreign operations, which are described under the heading "Risk Factors" in this annual report on Form 10-K.
Additional Information
Our website is located at www.cleanenergyfuels.com. We make available, free of charge on our website, our annual report on Form 10-K, quarterly reports on Form 10-Q, current reports on Form 8-K, and amendments to those reports filed pursuant to Section 13(a) or 15(d) of the Exchange Act as soon as reasonably practicable after we electronically file such material with, or furnish it to, the Securities and Exchange Commission. The reference to our website is intended to be an inactive textual reference and the contents of our website are not intended to be incorporated into this report.
An investment in our Company involves a high degree of risk of loss. You should carefully consider the risk factors discussed below and all of the other information included in this annual report on Form 10-K before you decide to purchase shares of our common stock. We believe the risks and uncertainties described below are the most significant we face. The occurrence of any of the following risks could harm our business. In that case, the trading price of our common stock could decline. Additional risks and uncertainties not presently known to us or that we currently deem immaterial may also impair our business and operations.
We have a history of losses and may incur additional losses in the future.
In 2012, 2013 and 2014, we incurred pre-tax losses of $99.6 million, $63.2 million, and $89.8 million, respectively. Our losses for 2012, 2013 and 2014 included derivative gains of $3.4 million, $0.9 million, and $5.7 million, respectively (see note 18 to our consolidated financial statements included in this report). During 2013 and 2014, our losses were substantially decreased by approximately $45.4 million and $28.4 million of revenue, respectively, from federal fuel tax credits, and the program under which we received such credits expired on December 31, 2014. We may never achieve or maintain profitability and our failure to do so would adversely affect our business, prospects and financial condition, and may cause the price of our common stock to fall.
Servicing our debt requires a significant amount of cash, and we may not have sufficient cash flow from our business to repay our debt.
At December 31, 2014, our total consolidated indebtedness was $570.7 million, including an aggregate of $295.0 million principal amount of the 7.5% Notes and the SLG Notes (each as defined in note 9 to our consolidated financial statements included in this report), which are convertible notes we issued in July 2011, August 2011, July 2012, and June 2013 bearing interest at a rate of 7.5% per annum (the "Series 2011 Notes"), and an aggregate of $250.0 million principal amount of the 5.25% Notes (as defined in note 9 to our consolidated financial statements included in this report), which are convertible notes we issued in September 2013 bearing interest at a rate of 5.25% per annum (the "Series 2013 Notes"). Further, in connection with our investment in, and purchase of property from, NG Advantage LLC in October 2014, we obligated ourselves to pay an additional $20.5 million to NG
16
Advantage LLC in 2015, $3.0 million of which has been paid. As of December 31, 2014 NG Advantage had outstanding debt totaling $9.9 million. We expect our total consolidated interest payment obligations relating to our indebtedness to be approximately $37.5 million for the year ending December 31, 2015. Approximately $4.8 million, $148.8 million, $4.1 million, $303.6 million and $53.1 million, respectively, of our consolidated indebtedness matures in 2015, 2016, 2017, 2018 and 2019, respectively. Our ability to make scheduled payments of the principal of and interest on our indebtedness depends on our future performance, which is subject to economic, financial, competitive and other factors, including those described in these risk factors, many of which are beyond our control. Our business may not generate cash flow from operations in the future sufficient to service our debt. If we are, or if we expect that we will be, unable to generate such cash flow, we may be required to adopt one or more alternatives, such as selling assets, restructuring debt or obtaining additional equity capital on terms that may be onerous to us or highly dilutive to our stockholders. Our ability to refinance our indebtedness, should we decide to do so, will depend on the capital markets and our financial condition at such time. We may not be able to engage in any of these activities or engage in these activities on desirable terms or at the desirable time, which could result in a default on our debt obligations. Additionally, our existing and future indebtedness may contain various restrictive covenants, and any failure by us to comply with any of these covenants could also cause us to be in default under the agreements governing the indebtedness. In the event of any such default, the holders of the indebtedness could, among other things, elect to declare all amounts owed immediately due and payable, which could cause all or a large portion of our available cash flow to be used to pay such amounts and thereby reduce the amount of cash available to pursue our business plans or force us into bankruptcy or liquidation. In addition, the substantial amount of our indebtedness, combined with our other financial obligations and contractual commitments, could have other important consequences. For example, it could make us more vulnerable to adverse changes in general U.S. and worldwide economic, industry and competitive conditions and adverse changes in government regulation, limit our flexibility to plan for, or react to, changes in our business and industry, place us at a disadvantage compared to our competitors who have less debt or limit our ability to borrow additional amounts. Further, we are permitted to repay the Series 2011 Notes and the Series 2013 Notes with shares of our common stock rather than cash, and any such issuances would increase the number of our outstanding shares.
Our success is dependent upon fleets' and other consumers' willingness to adopt natural gas as a vehicle fuel.
Our success is highly dependent upon the adoption by fleets and other consumers of natural gas as a vehicle fuel. If the market for natural gas as a vehicle fuel does not develop as we expect or develops more slowly than we expect, or if a market does develop but we are not able to capture a significant share of the market or the market subsequently declines, our business, prospects, financial condition and operating results will be harmed. The market for natural gas as a vehicle fuel is a relatively new, rapidly evolving market characterized by intense competition, evolving government regulation and industry standards and changing consumer demands and behaviors.
Factors that may influence the adoption of natural gas as a vehicle fuel include, among others:
-
-
Increases, decreases or volatility in the price of and cost to produce or obtain oil, gasoline, diesel or natural gas;
-
-
The availability of natural gas and the price of natural gas compared to gasoline, diesel and other vehicle fuels;
-
-
Natural gas vehicle cost, availability, quality, safety, design and performance, all relative to other vehicles;
-
- Improvements in the fuel economy of gasoline or diesel engines;
17
-
-
The entry or exit of engine manufacturers from the market;
-
-
Perceptions about greenhouse gas emissions (also known as "fugitive methane emissions") from natural gas production and transportation
methods, as well as from natural gas vehicles;
-
-
The availability and acceptance of other alternative fuels and alternative fuel vehicles;
-
-
Access to natural gas fueling stations and the convenience and cost to fuel a natural gas vehicle;
-
-
The availability of service for natural gas vehicles;
-
-
The environmental consciousness of fleets and consumers;
-
-
The existence and success of government incentives and grant programs that promote the use of natural gas as a vehicle fuel; and
-
- Concerns with the content of the natural gas supplied by natural gas fueling stations.
Increases, decreases and general volatility in oil, gasoline, diesel and natural gas prices could adversely impact our business.
In the recent past, the prices of oil, gasoline, diesel and natural gas have been volatile, and this volatility may continue. Market adoption of CNG, LNG and RNG as vehicle fuels could be slowed, curtailed or otherwise limited if there are significant decreases in the prices of, or significant increases in the supply and availability of, gasoline and diesel, today's most prevalent and conventional vehicle fuels, which would decrease the market's perception of a need for alternative vehicle fuels generally, or if there are decreases in the prices of gasoline and diesel without a corresponding decrease in the price of natural gas or an increase in the price of natural gas without corresponding increases in the prices of gasoline and diesel. The occurrence of any of these circumstances could cause the success or perceived success of our industry and our business to materially suffer. Part of the reason that such slowed, curtailed or limited adoption of natural gas as a vehicle fuel might occur under these circumstances is due to the higher cost of natural gas vehicles compared to gasoline- or diesel-powered vehicles, as the components needed for a vehicle to use natural gas add to a vehicle's base cost. If gasoline or diesel prices drop significantly, fuel economy of gasoline- or diesel-powered vehicles improves, or the prices of CNG and LNG are not sufficiently low, operators may delay or avoid the purchase of natural gas vehicles or decide not to convert their existing vehicles to run on natural gas because of a perceived inability to recover in a timely manner the additional costs of acquiring or converting to natural gas vehicles. In addition, our profit margins are directly impacted by fluctuations in natural gas, gasoline and diesel prices. In order to attract fleet operators and other consumers to convert to natural gas vehicles, we must be able to offer CNG and LNG fuel at prices significantly lower than gasoline and diesel. Decreases in the price of gasoline and diesel and increases in the price of natural gas make it more difficult for us to offer our customers discounted prices for CNG and LNG as compared to gasoline and diesel prices and maintain an acceptable margin on our sales. Further, increased natural gas prices affect the cost to us of natural gas and adversely impact our operating margins in cases where we cannot pass the increased costs on to our customers, and conversely, lower natural gas prices reduce our revenues in cases where the commodity cost is passed through to our customers.
Among the factors that can cause fluctuations in gasoline, diesel and natural gas prices are changes in domestic and foreign supplies and availability of crude oil and natural gas, domestic storage levels, price and availability of alternative fuels (including natural gas as an alternative to gasoline and diesel and gasoline and diesel as an alternative to natural gas), weather conditions, negative publicity surrounding natural gas drilling techniques or methods or producing and importing oil, level of consumer demand, economic conditions, the price of foreign imports, and domestic and foreign governmental regulations and political conditions. With respect to natural gas supply, there have been recent efforts to place new regulatory requirements on the production of natural gas by hydraulic
18
fracturing of shale gas reservoirs and on transporting and dispensing natural gas. Hydraulic fracturing and horizontal drilling techniques has resulted in a substantial increase in the proven natural gas reserves in the United States, and any changes in regulations that make it more expensive or unprofitable to produce natural gas through such techniques or others, as well as any changes to the regulations relating to transporting or dispensing natural gas, could lead to increased natural gas prices. Additionally, crude oil prices have recently been subject to extreme volatility and decreases, due in part to over-production and increased supply without a corresponding increase in demand. If these circumstances continue, or if all or some combination of the factors contributing to volatile natural gas, oil and diesel prices were to occur or worsen, perceptions about the success of our industry could be materially harmed, which could cause our stock price to decline and could cause our results of operations and prospects to suffer.
If trucks using the Cummins Westport ISX 12G natural gas engine (or a comparable engine) are not adopted by truck operators as quickly or to the extent we anticipate, our results of operations and business prospects will be adversely affected.
We believe the development and expansion of the U.S. natural gas heavy-duty truck market, and the execution of our America's Natural Gas Highway initiative, depends upon the successful adoption of the Cummins Westport ISX 12G natural engine (or a comparable engine) and the development of a meaningful market in the U.S. for heavy-duty natural-gas trucks. Manufacturers may not produce natural gas engines and truck operators may not adopt and deploy natural gas trucks in meaningful numbers or as quickly as we anticipate. Heavy-duty trucks powered by natural gas engines cost more, as compared to comparable gasoline or diesel trucks, and may experience, or be perceived to experience, more operational or performance issues. If meaningful numbers of natural gas heavy-duty truck engines are not deployed, if such deployment is slower than expected, or if a meaningful number of the trucks that are deployed are not fueled at our stations, our business and financial results would be harmed.
The failure of our America's Natural Gas Highway initiative and our inability to achieve our goal to fuel a substantial number of natural gas heavy-duty trucks would materially and adversely affect our financial results and business.
We are seeking to fuel a substantial number of natural gas heavy-duty trucks, and in connection with that effort we are building America's Natural Gas Highway, a network of natural gas truck-friendly fueling stations. Our objectives to fuel a substantial number of heavy-duty trucks and build America's Natural Gas Highway have required, and will continue to require, a significant commitment of capital and other resources, and our ability to successfully execute our plans faces substantial risks, including, among others:
-
-
Many of our existing ANGH stations were initially built to provide LNG and LNG costs more than CNG on an energy equivalent basis. If
CNG becomes the preferred fuel for truck operators, we will be required to spend significant additional capital to add CNG fueling capability to many of our ANGH stations, and we may not have
sufficient capital for that purpose;
-
-
Our ANGH stations may experience mechanical or operational difficulties, which could require significant costs to repair and could
reduce customer confidence in our stations;
-
-
Truck and vehicle operators may not fuel at our stations due to lack of access or convenience, prices, concerns with natural gas
content or reliability or numerous other factors;
-
- We have no influence over the development, production, cost or availability of natural gas trucks powered by engines that are well-suited for the U.S. heavy-duty truck market. At December 31, 2014, there was only one principal natural gas engine manufacturer for the medium- and heavy-duty market, Cummins Westport ("CWI"). We have no control over whether CWI will remain in
19
-
-
Operators may not adopt heavy-duty natural gas trucks due to cost, actual or perceived performance issues, or other factors that are
outside our control;
-
-
We may not be able to obtain acceptable margins on fuel sales at ANGH stations; and
-
- Many ANGH stations (approximately 92 stations at December 31, 2014) were completed before there were sufficient numbers of customers that will fuel at the stations, and if such customers do not materialize, we will continue to have substantial investments in assets that do not produce revenues equal to or greater than their costs and we may lose money on LNG that is supplied to the stations but is not purchased by customers.
the natural gas engine business or whether other manufacturers will enter the natural gas engine business;
We must effectively manage these risks and any other risks that may arise in connection with the ANGH build-out to successfully execute our business plan. If the U.S. market for heavy-duty natural gas trucks does not develop or if we fail to successfully execute our ANGH initiative and fuel a substantial number of natural gas heavy-duty trucks, our financial results, operations and business, and our ability to repay our debt, will be materially and adversely affected.
Automobile and engine manufacturers produce very few natural gas vehicles and engines for the United States and Canadian markets, which limits our customer base and our sales of CNG, LNG and RNG.
Limited availability of natural gas vehicles and engine sizes, including heavy-duty trucks and other types of vehicles, restricts their large-scale introduction and narrows our potential customer base. Original equipment manufacturers produce a relatively small number of natural gas engines and vehicles in the U.S. and Canadian markets, and they may not decide to expand, or they may decide to discontinue or curtail, their existing natural gas engine or vehicle product lines. A limited supply of natural gas vehicles limits our customer base and natural gas fuel sales and encourages existing manufacturers to charge a premium for such vehicles, thereby restricting our ability to promote natural gas vehicles, all of which has a negative impact on our business, operations and prospects.
We may need to raise additional debt or equity capital to continue to fund the growth of our business.
At December 31, 2014, we had total cash and cash equivalents of $92.4 million and short-term investments of $122.5 million. Our business plan calls for approximately $58.3 million in capital expenditures for 2015, as well as substantial capital expenditures thereafter. We may also require capital to make principal or interest payments on our indebtedness or for unanticipated expenses, mergers and acquisitions and strategic investments. As a result, we may find it necessary to raise additional capital through selling current assets or pursuing debt or equity financing.
Asset sales and equity or debt financing options may not be available when needed or on terms favorable to us, or at all. Any sale of our assets may limit our operational capacity and could limit or eliminate any business plans that are dependent on the sold assets. Additional issuances of our common stock or securities convertible into our common stock would increase the number of our outstanding shares. We may also pursue debt financing since, despite our level of consolidated debt, the agreements governing much of our existing debt do not restrict our ability to incur additional indebtedness, including secured and unsecured indebtedness, or require us to maintain financial ratios or specified levels of net worth or liquidity. Debt financing options that we may pursue include, among others, equipment financing, the sale of convertible notes, high yield debt, asset -based loans, term loans, project finance debt, municipal bond financing or commercial bank financing. Any debt financing we obtain may require us to make significant interest payments and to pledge some or all of our assets as security. In addition, if we incur additional indebtedness in the future, these higher levels of indebtedness could increase the risk that we would be unable to repay our debt or make other required
20
payments and could adversely affect our creditworthiness, which could limit our ability to obtain further debt or equity financing as needed and restrict our flexibility in responding to changing business and economic conditions, any of which could negatively impact our business and prospects. On the other hand, if we are unable to obtain capital in amounts sufficient to fund our contractual obligations, our business plan, and any unanticipated expenses, capital expenditures, mergers, acquisitions or strategic investments, we would be forced to suspend, delay or curtail these capital expenditures or other transactions, which would harm our business, results of operations, and future prospects.
Our business is influenced by environmental, tax and other government regulations, programs and incentives promoting cleaner burning fuels and alternative fuel vehicles, and their modification or repeal could adversely impact our business.
Our business is influenced by federal, state and local government tax attributes, credits, rebates, grants and similar programs and incentives that promote the use of natural gas and RNG as a vehicle fuel, as well as by laws, rules and regulations that require reductions in carbon emissions. Industry participants with a vested interest in gasoline and diesel or alternative fuels such as hydrogen- or electric-powered vehicles, many of which have substantially greater resources than we have, invest significant time and money in efforts to influence environmental regulations in ways that could delay or repeal regulations and programs that promote natural gas as a vehicle fuel. Any failure to adopt, delay in implementing, expiration, repeal or modification of federal, state or local regulations, programs or incentives that encourage the use of natural gas and RNG as a vehicle fuel would harm our operating results and financial condition. For example, some such government programs and incentives have recently expired, such as the VETC of $0.50 per gasoline gallon equivalent of CNG and liquid gallon of LNG sold for vehicle fuel use, which expired December 31, 2014 and has not been reinstated. In 2013 and 2014 we recorded approximately $45.4 million and $28.4 million of revenue, respectively, related to VETC fuel tax credits, representing approximately 12.9% and 6.6%, respectively, of our total revenue during the periods. Additionally, changes to or the repeal of laws, rules and regulations that mandate reductions in carbon emissions and/or the use of renewable fuels, including the California Low Carbon Fuel Standard and the federal RFS Phase 2, under which we generate LCFS Credits and RIN Credits by selling natural gas and RNG as a vehicle fuel, would adversely affect our financial condition. For example, the staff of the the California Air Resources Board recently proposed changing its carbon intensity number for CNG, LNG and RNG to take into account alleged system-wide methane losses, which change, if implemented, would result in fewer carbon benefits associated with use of natural gas as a vehicle fuel and would adversely affect our business. Further, the failure of any proposed federal, state or local government incentives that promote the use of natural gas as a vehicle fuel, the use of renewable fuels or reductions in carbon emissions to pass into law could result in a negative perception of our industry and business by the market generally and could result in a decline in the market price of our common stock. Additionally, if grant funds cease to be available under government programs for the purchase and construction of natural gas vehicles and stations, these activities could slow and our business and results of operations may be adversely affected.
We face increasing competition from oil and gas and other alternative fuel and alternative fuel vehicle companies, fuel providers, refuse companies, industrial gas companies, natural gas utilities, fuel station and truck stop owners, and other organizations that may have far greater resources and brand awareness than we have.
A significant number of established businesses, including oil and gas companies, other alternative vehicle and alternative fuel companies, refuse collectors, natural gas utilities and their affiliates, industrial gas companies, truck stop and fuel station owners, fuel providers and other organizations have entered or are planning to enter the markets for natural gas and other alternatives for use as vehicle fuels. Additionally, for certain of our key customer markets, such as airports, taxis and paratransit vehicles, we indirectly compete with companies providing alternative transportation means
21
that may limit these markets generally, such as Uber and Lyft. Many of these current and potential competitors have substantially greater financial, marketing, research and other resources than we have. Further, new technologies and improvements to existing technologies may make alternatives other than natural gas more attractive to the market, or may slow the development of a market for natural gas as a vehicle fuel if such advances are made with respect to oil and gas usage. Natural gas utilities also own and operate natural gas fueling stations that compete with our stations. The California Public Utilities Commission has approved a compression services tariff application by the Southern California Gas Company, allowing the utility to compete with us by building and owning natural gas compression equipment on customer property and by providing operation and maintenance services to customers. Further, utilities in several other states, including Michigan, Illinois, New Jersey, North Carolina, Oregon, Maryland, Washington, Kentucky and Georgia, either have or are preparing to enter the natural gas vehicle fuel business. Utilities, in particular, have unique competitive advantages, including their typically lower cost of capital, substantial and predictable cash flows, long-standing customer relationships, greater brand awareness and large and well-trained sales and marketing organizations.
We expect competition to intensify in the near term in the alternative vehicle fuels market generally and, assuming the use of natural gas vehicles and the demand for natural gas vehicle fuel increases, the market for natural gas vehicle fuel. Increased competition will lead to amplified pricing pressure and reduced operating margins. Our failure to compete successfully in the markets in which we operate would adversely affect our business and financial results.
If there are advances in other alternative vehicle fuels or technologies, or if there are improvements in gasoline, diesel or hybrid engines, demand for natural gas vehicles may decline and our business would suffer.
Technological advances in the production, delivery and use of alternative fuels that are, or are perceived to be, cleaner, more cost-effective or more readily available than CNG, LNG or RNG have the potential to slow or limit adoption of natural gas vehicles. Advances in gasoline and diesel engine technology, especially hybrids, may offer a cleaner, more cost-effective option and make fleet customers less likely to convert their fleets to natural gas. Technological advances related to ethanol or biodiesel, which are increasingly used as an additive to, or substitute for, gasoline and diesel fuel, may slow the need to diversify fuels and affect the growth of the natural gas vehicle market. Use of electric heavy-duty trucks, buses and trash trucks, or the perception that such vehicles may soon be widely available and provide satisfactory performance, may reduce demand for natural gas vehicles. In addition, hydrogen and other alternative fuels in experimental or developmental stages may offer a cleaner, more cost-effective alternative to gasoline and diesel than natural gas. Advances in technology that slow or curtail the growth of or conversion to natural gas vehicles, or which otherwise reduce demand for natural gas as a vehicle fuel, will have an adverse effect on our business. Failure of natural gas vehicle technology to advance at a sufficient pace may also limit its adoption and our ability to compete with other alternative fuels and alternative fuel vehicles.
We are subject to risks associated with our station construction and similar activities, including difficulties identifying suitable station locations, zoning, permitting or other local resistance, cost overruns, delays, and other contingencies, any of which could have a material adverse effect on our business and results of operations.
In connection with our station construction operations, we may not be able to identify, obtain and retain sufficient permits, approvals and other rights to use suitable locations for the stations we or our customers seek to build. We may also encounter land use or zoning difficulties or other local resistance with respect to stations that prohibits us or our customers from building new stations on preferred sites or limits or restricts the use of new or existing stations. Any such difficulties, resistance or limitations could damage our reputation and harm our business and results of operations. In addition, we act as the general contractor and construction manager for station construction and facility modification
22
projects and typically rely on licensed subcontractors to perform the construction work. We may be liable for any damage we or our subcontractors cause during the course of our projects. Shortages of skilled subcontractor labor for our projects could significantly delay a project or otherwise increase our costs. Our profit on our projects is based in part on assumptions about the cost of the projects. Cost overruns, delays or other execution issues may, in the case of projects that we complete and sell to customers, result in our failure to achieve our expected margins or cover our costs, and in the case of projects that we build and own, result in our failure to achieve an acceptable rate of return.
Our manufacturing operations could subject us to significant costs and other risks, including product liability claims.
Our subsidiary, IMW, designs, manufactures, sells and services non-lubricated natural gas compressors and related equipment used in CNG stations. The equipment IMW produces and sells has not in some instances performed, and may not in the future perform, as expected, according to legal or other specifications, or at all. IMW has in the past and may in the future incur significant and unexpected costs in the product life cycle, including costs incurred to fix any discovered performance errors and to repair any product malfunctions. The scope and likelihood of these risks continues to increase as IMW makes efforts to expand its services to new geographic and other markets. The occurrence of any of these risks has and will damage our customer relationships and reputation, delay the launch of new IMW products, force product recalls and/or result in product liability claims, any one of which could have a material adverse effect on our results of operations and financial condition.
Our warranty reserves may not adequately cover our warranty obligations and increased or unexpected product warranty claims could adversely impact our financial condition and results of operations.
We provide product warranties with varying terms and durations for natural gas compressors and stations we build and sell to customers, and we establish reserves for the estimated liability associated with our product warranties. Our warranty reserves are based on historical trends as well as our understanding of specifically identified warranty issues. The amounts estimated could differ materially from actual warranty costs that may ultimately be realized. An increase in the rate of warranty claims, the average amount involved with each warranty claim or the occurrence of unexpected warranty claims could have a material adverse effect on our financial condition or results of operations.
Increased IT security threats and more sophisticated and targeted computer crime could pose a risk to our systems, networks, products, solutions and services.
Increased global IT security threats and more sophisticated and targeted computer crime pose a risk to the security of our systems and networks and the confidentiality, availability and integrity of our data. Depending on their nature and scope, such threats could potentially lead to the compromising of confidential information, improper use of our systems and networks, manipulation and destruction of data and operational disruptions, which in turn could adversely affect our reputation, competitiveness and results of operations.
The global scope of our operations exposes us to additional risks and uncertainties.
Our IMW subsidiary has operations in a number of countries, including the United States, Canada, China, Colombia, Bangladesh and Peru. IMW's natural gas compression equipment is primarily manufactured in Canada and sold globally, which exposes us to a number of risks that can arise from international trade transactions, local business practices and cultural considerations. In addition to the other risks described in these risk factors, the global scope of our operations may subject us to risks and uncertainties that may limit our operations, increase our costs or otherwise negatively impact our business and financial condition, including, among others:
-
- Compliance with the United States Foreign Corrupt Practices Act;
23
-
-
Political unrest, terrorism, war, natural disasters and economic and financial instability;
-
-
Unexpected changes in regulatory requirements and uncertainty related to developing legal and regulatory systems governing economic
and business activities, real property ownership and application of contract rights;
-
-
Trade restrictions and import-export regulations;
-
-
Difficulties enforcing agreements and collecting receivables;
-
-
Difficulties complying with the laws and regulations of multiple jurisdictions;
-
-
Difficulties ensuring that health, safety, environmental and other working conditions are properly implemented and/or maintained by
the local office;
-
-
Differing employment practices and/or labor issues, including wage inflation, labor unrest and unionization policies;
-
-
Limited intellectual property protection;
-
-
Longer payment cycles by international customers;
-
-
Inadequate local infrastructure and disruptions of service from utilities or telecommunications providers, including electricity
shortages; and
-
- Potentially adverse tax consequences.
In addition to the above, we also face risks associated with currency exchange and convertibility, inflation and repatriation of earnings as a result of our foreign operations. In some countries, economic, monetary and regulatory factors could affect our ability to convert funds to United States dollars or move funds from accounts in these countries. We are also vulnerable to appreciation or depreciation of foreign currencies against the United States dollar, which could negatively impact our operating results and financial performance.
We depend on key personnel to operate our business, and if we are unable to retain our current personnel or hire additional qualified personnel, our ability to develop and successfully market our business would be harmed.
We believe that our future success is highly dependent on the contributions of our executive officers, as well as our ability to attract and retain highly skilled managerial, sales, technical and finance personnel. Qualified individuals are in high demand, and we may incur significant costs to attract and retain them. All of our executive officers and other United States employees may terminate their employment relationships with us at any time, and their knowledge of our business and industry would be extremely difficult to replace. If we are unable to retain our executive officers and key employees or, if such individuals leave our company, we are unable to attract and successfully integrate quality replacements, our business, operating results and financial condition could be harmed.
We have significant contracts with federal, state and local government entities that are subject to unique risks.
We have, and will continue to seek, long-term CNG, LNG and RNG station construction, maintenance and fuel sales contracts with various federal, state and local governmental bodies, which accounted for approximately 33%, 19% and 18% of our annual revenues in 2012, 2013 and 2014, respectively. In addition to normal business risks, our contracts with these government entities are often subject to unique risks, some of which are beyond our control. Long-term government contracts and related orders are subject to cancellation if adequate appropriations for subsequent performance periods are not made. The termination of funding for a government program supporting any of our government contracts could result in a loss of anticipated future revenues attributable to that contract,
24
which could have a negative impact on our operations. In addition, government entities with which we contract are often able to modify, curtail or terminate contracts with us without prior notice at their convenience, and are only liable for payment for work done and commitments made at the time of termination. Modification, curtailment or termination of significant contracts could have a material adverse effect on our results of operations and financial condition. Further, government contracts are frequently awarded only after competitive bidding processes, which are often protracted. In many cases, unsuccessful bidders for government contracts are provided the opportunity to formally protest certain contract awards through various agencies or other administrative and judicial channels. The protest process may substantially delay a successful bidder's contract performance, result in cancellation of the contract award entirely and distract management. As a result, we may not be awarded contracts for which we bid, and substantial delays or cancellation of contracts may follow any successful bids as a result of such protests, any of which could harm our business and results of operations.
We may never initiate or complete construction of the GE Plants. If we commence construction of either GE Plant, we may encounter difficulties building them and we would need to comply with significant obligations to GE.
Our ability to commence development and construction of the GE Plants, to be financed under our credit agreement with GE, will depend on our satisfaction of a number of conditions, including the availability of sites upon which to construct the GE Plants, our ability to acquire title to, or leasehold interests in, such sites and the receipt of all governmental approvals necessary to design, develop, own, construct, install, operate and maintain the GE Plants. If we do not satisfy all of the conditions by December 31, 2016, GE's obligation to fund the GE Plants will terminate.
If we commence construction of either GE Plant, we may not be able to comply with all of our obligations to GE under the applicable credit agreement. For example, we may not complete one or both of the GE Plants within the required time period, or we may not make our required equity contributions to the GE Plants, which consist of all funding required to complete the plants in excess of the $200 million to potentially be loaned to us by GE. The GE Plants may cost more than we expect, and we may not be able to pay any additional costs. If the GE Plants are completed, they may not generate enough cash flow to pay our obligations to GE because they may experience operational difficulties or inefficiencies or we may not be able to sell enough of the LNG the GE Plants produce. If we construct the GE Plants and we do not fulfill our obligations to GE, we would lose some or all of our investments in the GE Plants.
Our ability to obtain LNG is constrained by fragmented and limited production and increasing competition for LNG supply.
Production of LNG in the United States is fragmented and limited. It may be difficult for us to obtain LNG without interruption and near our current or target markets at competitive prices, when needed, or at all. If LNG liquefaction plants we own, or if any from which we purchase LNG, are damaged by severe weather, earthquakes or other natural disasters or otherwise experience prolonged down time, if any such plants cannot produce LNG meeting applicable composition specifications and requirements, or if we or others do not build additional LNG liquefaction plants, our LNG supply will be restricted. If we are unable to supply enough LNG that satisfies applicable specifications (either from our own plants or by purchasing it from third parties) to meet customer demand, we may lose customers and/or be liable to our customers for penalties and damages. Competition for LNG supply is escalating. For example, we increasingly compete to purchase LNG with other companies that use LNG to fuel equipment deployed in oil and gas production activities. In addition, we expect that the execution of our business plan will require substantial growth in the available LNG supply across the United States, and if this supply is unavailable, it would constrain our ability to serve the market we anticipate for LNG fuel, including the heavy-duty truck market, and would adversely affect our
25
investments in America's Natural Gas Highway. If we experience an LNG supply interruption or LNG demand that exceeds available supply, or if we have difficulty entering or maintaining relationships with contract carriers to deliver LNG on our behalf, our ability to expand LNG sales to new customers will be limited and our relationships with existing customers may be disrupted, any of which could adversely affect our results of operations. Furthermore, because transportation of LNG is relatively expensive, if we are required to supply LNG from distant locations and cannot pass these costs through to our customers, our operating margins will decrease due to our increased transportation costs.
LNG supply purchase commitments may exceed demand, causing our costs to increase.
We are a party to one long-term LNG supply agreement that has a take-or-pay commitment, and we may enter into additional contracts with take-or-pay commitments in the future. Take-or-pay commitments require us to pay for the LNG that we have agreed to purchase irrespective of whether we can sell the LNG. Should the market demand for LNG decline or fail to develop as we anticipate, if we lose significant LNG customers, if demand under any existing or any future LNG sales contract does not maintain its volume levels or grow, or if future demand for LNG otherwise does not meet our expectations, these commitments may cause our operating and supply costs to increase without a corresponding increase in revenue and our margins may be negatively impacted.
Compliance with potential greenhouse gas regulations affecting our LNG plants or fueling stations may prove costly and negatively affect our financial performance.
California has adopted legislation, AB 32, which calls for a cap on greenhouse gas emissions throughout California and a statewide reduction to 1990 levels by 2020 and an additional 80% reduction below 1990 levels by 2050. Other states and the federal government are considering passing similar measures to regulate and reduce greenhouse gas emissions. Any of these regulations, when and if implemented, may regulate the greenhouse gas emissions produced by our LNG production plants, our CNG and LNG fueling stations or our RNG production facilities and require that we obtain emissions credits or invest in costly emissions prevention technology. We cannot currently estimate the potential costs associated with compliance with federal, state or local regulation of greenhouse gas emissions and these unknown costs are not contemplated by our current customer agreements. If any of these regulations are implemented, our associated compliance costs may have a negative impact on our financial performance, reduce our margins and impair our ability to fulfill customer contracts.
Our operations entail inherent safety and environmental risks that may result in substantial liability to us.
Our operations entail inherent risks, including equipment defects, malfunctions and failures, which could result in uncontrollable flows of natural gas, fires, explosions and other damages. For example, operation of LNG pumps requires special training because of the extreme low temperatures of LNG. LNG tanker trailers have also in the past been, and may in the future be, involved in accidents that result in explosions, fires and other damage. Further, improper refueling of natural gas vehicles can result in venting of methane gas, which is a potent greenhouse gas, and such methane emissions may in the future be regulated by the EPA or by state regulatory agencies. Additionally, CNG fuel tanks and trailers, if damaged by accidents or improperly maintained or installed, may rupture and the contents of the tank or trailer may rapidly decompress and result in death or serious injury. These risks may expose us to liability for personal injury, wrongful death, property damage, pollution and other environmental damage. We may incur substantial liability and cost if damages are not covered by insurance or are in excess of policy limits.
We provide financing to fleet customers for natural gas vehicles, which exposes our business to credit risks.
We lend to certain qualifying customers a portion of, and occasionally up to 100% of, the purchase price of natural gas vehicles. We may also lease vehicles to customers. There are risks associated with
26
providing financing including the following, among others: (i) the equipment financed consists mostly of vehicles that are mobile and easily damaged, lost or stolen, (ii) the borrower may default on payments, enter bankruptcy proceedings and/or liquidate, (iii) we may not be able to bill properly or track payments in an adequate fashion to properly manage this service, and (iv) the amount of capital available to us is limited and may not allow us to make loans required by customers. As of December 31, 2014, we had $8.3 million outstanding in loans provided to customers to finance natural gas vehicle purchases.
Our business is subject to a variety of governmental regulations that may restrict our operations and may result in costs and penalties.
We are subject to a variety of federal, state and local laws and regulations relating to foreign business practices, the environment, health and safety, labor and employment, building codes and construction, land use and taxation, among others. It is difficult and costly to manage the requirements of every individual authority having jurisdiction over our various activities and to comply with these varying standards. These laws and regulations are complex, change frequently and have tended to become more stringent over time. Any changes to existing regulations or adoption of new regulations may result in significant additional expense to us and our customers. Further, from time to time, as part of the regular overall evaluation of our operations, including newly acquired or developing operations, we may be subject to compliance audits by regulatory authorities, which may involve significant costs and use of other resources. Also, in connection with our operations, we often need facility permits or licenses to address, among other things, storm water or wastewater discharges, waste handling, and air emissions, which may subject us to onerous or costly permitting conditions. Compliance with these laws and regulations and enforcement policies of regulatory agencies could require us to make material expenditures and may distract our officers, directors and employees.
Our failure to comply with any applicable laws and regulations may result in a variety of administrative, civil and criminal enforcement measures, including assessment of monetary penalties and the imposition of corrective requirements. In addition, any failure to comply with regulations related to the government procurement process at the federal, state or local level or restrictions on political activities and lobbying may result in administrative or financial penalties, including being barred from providing services to governmental entities.
Our RNG business may not be successful.
We own RNG production facilities located in Canton, Michigan and North Shelby, Tennessee. We are also seeking to increase our RNG business by pursuing additional projects on our own and with project partners. We may not be successful in operating or developing these projects or any future projects or generating a financial return from our investments. Historically, projects that produce pipeline quality RNG have often failed due to the volatile prices of conventional natural gas, unpredictable RNG production levels, technological difficulties and costs associated with operating the production facilities, and the absence of government programs and regulations that support such activities. The success of our RNG business depends on our ability to obtain necessary financing, to successfully manage the construction and operation of RNG production facilities and to either sell RNG at substantial premiums to prices for conventional natural gas prices or to sell, at favorable prices, credits we may generate under federal or state laws, rules and regulations, including RINs and LCFS Credits. If we are not successful at one or more of these activities, our RNG business could fail and our operations and financial results may be materially and adversely affected.
The market for RINs and LCFS Credits is volatile, and the prices for such credits may be subject to significant fluctuations. Further, the value of RINs and LCFS Credits will be adversely affected by any changes to the state and federal programs under which such credits are generated and sold. In the absence of state and federal programs that support premium prices for RNG or that allow us to
27
generate and sell LCFS Credits and RINs or other credits, or if our customers are not otherwise willing to pay a premium for RNG, we may be unable to profitably operate our RNG business.
We have experienced, and may continue to experience, difficulties producing RNG.
We have experienced difficulty producing the expected volumes of RNG at our operational RNG plants due to, among other factors, problems with key equipment, severe weather, landfill conditions and construction delays. These difficulties may continue or worsen in the future, and our ability to produce RNG may be adversely affected by a number of other factors beyond our control, including, among others, limited availability or unfavorable composition of collected landfill gas, failure to obtain and renew necessary permits, landfill mismanagement, problems with our critical equipment, and adverse or severe weather conditions. In addition, we may seek to or be required to upgrade, expand or service our RNG facilities, which may result in plant shutdowns, cause delays that reduce the amount of RNG we produce or involve significant unexpected costs. Our financial results and operations will be negatively impacted if any of these factors limit our ability to produce sufficient quantities of RNG.
If our subsidiary, Canton Renewables, LLC ("Canton"), does not comply with its financing agreements, we may lose our interest in our Canton, Michigan RNG production facility.
Our subsidiary Canton, which directly owns our RNG production facility located in Canton, Michigan, has issued secured debt to third parties. If Canton does not comply with its obligations and covenants under this debt instrument (including its obligations to pay principal and interest), we may lose our interest in Canton's RNG production project.
We may from time to time pursue acquisitions, investments or other strategic relationships, which could fail to meet expectations.
We may acquire or invest in other companies or businesses. For example, in October 2014, we invested in and purchased a CNG station from NG Advantage. In addition, we may pursue other strategic transactions or relationships. For instance, in September 2014, we formed MCEP. Acquisitions, investments and other strategic partnerships and relationships involve numerous risks, any of which could harm our business, including, among others, the following: difficulties integrating the technologies, operations, existing contracts and personnel of an acquired company or partner; difficulties in supporting and transitioning vendors, if any, of an acquired company or partner; diversion of financial and management resources from existing operations or alternative acquisition or investment opportunities; failure to realize the anticipated benefits or synergies of a transaction or relationship; failure to identify all of the problems, liabilities or other shortcomings or challenges of a company or technology we may acquire, invest in or partner with, including issues related to intellectual property, regulatory compliance practices, revenue recognition or other accounting practices or employee or customer issues; risks of entering new markets in which we may have limited or no experience; potential loss of key employees, customers and vendors from either our current business or an acquired company's or partner's business; inability to generate sufficient revenue to offset acquisition, investment or other related costs; additional costs or equity dilution associated with funding the acquisition, investment or other relationship; and possible write-offs or impairment charges relating to the businesses we partner with, invest in or acquire. The occurrence of any of these risks would cause our business, financial condition and operating results to suffer.
Our quarterly results of operations are difficult to predict and have fluctuated significantly.
Our quarterly results of operations have historically experienced significant fluctuations. Our net losses were approximately $31.9 million, $11.3 million, $16.3 million, $41.7 million, $3.9 million, $11.9 million, $18.8 million, $32.3 million, $28.6 million, $32.3 million, and $30.1 million for the three months ended March 31, 2012, June 30, 2012, September 30, 2012, December 31, 2012, March 31,
28
2013, June 30, 2013, September 30, 2013, December 31, 2013, March 31, 2014, June 30, 2014, September 30, 2014, respectively. In the three months ended December 31, 2014, our net income was $1.3 million. Our quarterly results of operations may fluctuate significantly as a result of a variety of factors, including those described in these risk factors, many of which are beyond our control. If our quarterly results of operations fall below the expectations of securities analysts or investors, the price of our common stock could decline substantially. As a result of the significant variances in our operating results in prior periods, period-to-period comparisons of our operating results may not be meaningful and investors in our common stock should not rely on the results of one quarter as an indication of future performance.
Sales of shares could cause the market price of our stock to drop significantly, even if our business is doing well.
As of December 31, 2014, there were 90,203,344 shares of our common stock outstanding, 11,486,301 shares underlying outstanding options, 2,591,752 shares underlying restricted stock units, 2,130,682 shares underlying outstanding Series I warrants (all of which were sold in November 2008), 5,000,000 shares underlying a warrant we issued in November 2012 to GE, 19,160,338 shares underlying our Series 2011 Notes and 16,025,641 shares underlying our Series 2013 Notes. All of our outstanding shares are eligible for sale in the public market, subject in certain cases to the requirements of Rule 144 of the Securities Act. Also, shares subject to outstanding options, warrants and convertible notes are eligible for sale in the public market to the extent permitted by the provisions of the applicable option, warrant and convertible note agreements and Rule 144, or if such shares have been registered for resale under the Securities Act. If these shares are sold, or if it is perceived that they will be sold in the public market, the trading price of our common stock could decline.
As of December 31, 2014, 18,139,720 shares of our common stock held by our co-founder and board member T. Boone Pickens were pledged as security for loans made to Mr. Pickens. We are not a party to these loans. If the price of our common stock declines, Mr. Pickens may be forced to provide additional collateral for the loans or to sell shares of our common stock in order to remain within the margin limitations imposed under the terms of the loans. Any sales of common stock following a margin call that is not satisfied may cause the price of our common stock to decline further. In addition, a number of our directors and officers have in the past entered into Rule 10b5-1 sales plans with a broker to sell shares of our common stock that they hold or that they may acquire upon the exercise of stock options. Sales under these plans occur automatically without further action by the director or officer once the price, date or other parameters of the particular selling plan are achieved. As of December 31, 2014, no shares were subject to future sales by our directors and officers under these selling plans. If our directors and officers adopt new selling plans and sales of shares under these selling plans occur, the trading price of our common stock could fall.
A significant portion of our stock is beneficially owned by a single stockholder whose interests may differ from yours and who is able to exert significant influence over our corporate decisions, including a change of control.
As of December 31, 2014, T. Boone Pickens beneficially owned in the aggregate approximately 24.2% of our common stock (including 18,139,720 shares of common stock, 705,000 shares underlying stock options exercisable within 60 days of December 31, 2014, and 4,113,923 shares underlying convertible promissory notes he holds). As a result, Mr. Pickens is able to strongly influence or control matters requiring approval by our stockholders, including the election of directors and the approval of mergers, acquisitions or other extraordinary transactions. Mr. Pickens may have interests that differ from yours and may vote in a way with which you disagree and that may be adverse to your interests. This concentration of ownership may have the effect of delaying, preventing or deterring a change of control of our Company, could deprive our stockholders of an opportunity to receive a premium for
29
their stock as part of a sale of our Company, and might ultimately affect the market price of our common stock. Conversely, this concentration may facilitate a change of control at a time when you and other investors may prefer not to sell.
Our stock price may be volatile.
The market price of our common stock has experienced, and may continue to experience, significant volatility. Such volatility may be in response to various factors, some of which are beyond our control. In addition to the other factors discussed in these risk factors, factors that may cause volatility in our stock price include, among others:
-
-
Changes in prices for oil, traditional vehicle fuels such as gasoline and diesel, and natural gas;
-
-
Adoption of and growth of the market for natural gas as a vehicle fuel;
-
-
Our ability to fuel a substantial number of natural gas heavy-duty trucks and other natural gas vehicles;
-
-
Adoption by the U.S. heavy-duty truck market of engines that operate on natural gas;
-
-
Successful implementation of our business plans, including, without limitation, our ANGH initiative;
-
-
Production and supply of LNG and RNG;
-
-
Investor perception of our industry or our prospects;
-
-
Fluctuations in our operating results;
-
-
Sales of our common stock by us, our officers or directors, or significant stockholders;
-
-
A decline in the trading volume of or the price for our common stock;
-
-
Oil and gas companies, natural gas utilities and others entering the market for natural gas fuel;
-
-
Changes in our key personnel;
-
-
Competitive developments; and
-
- Changes in general economic and market conditions.
In addition, the securities markets have from time to time experienced significant price and volume fluctuations that are unrelated to the operating performance of particular companies, and in such instances, have affected the market prices of these companies' securities. These market fluctuations may also materially and adversely affect the market price of our common stock.
Item 1B. Unresolved Staff Comments.
None.
Our corporate headquarters are located at 4675 MacArthur Court, Suite 800, Newport Beach, CA 92660, where we occupy approximately 68,000 square feet. Our office lease expires on June 30, 2021.
We own and operate the Pickens Plant located in Willis, Texas, approximately 50 miles north of Houston. We own approximately 24 acres on which the plant is situated, along with approximately 34 acres surrounding the plant.
We own and operate the Boron Plant in Boron, California, approximately 125 miles from Los Angeles. In November 2006, we entered into a 30 -year ground lease for the 36 acres on which this
30
plant is situated, pursuant to which we pay annual base rent payments of $230,000 per year, plus up to $130,000 per year for each 30,000,000 gallons of production capacity utilized, subject to future adjustment based on consumer price index changes.
We lease the land upon which we operate our RNG production facilities in North Shelby, Tennessee and Canton, Michigan.
We lease a manufacturing facility in Chilliwack, British Columbia where we occupy approximately 81,000 square feet. The facility lease expires in January 2018.
We are party to various legal actions that have arisen in the ordinary course of our business. During the course of our operations, we are also subject to audit by tax authorities for varying periods in various federal, state, local, and foreign tax jurisdictions. Disputes have arisen, and may continue to arise, during the course of such audits as to facts and matters of law. It is impossible to determine the ultimate liabilities that we may incur resulting from any such lawsuits, claims and proceedings, audits, commitments, contingencies and related matters or the timing of these liabilities, if any. If these matters were to ultimately be resolved unfavorably, an outcome not currently anticipated, it is possible that such outcome could have a material adverse effect upon our consolidated financial position, results of operations or liquidity. However, we believe that the ultimate resolution of such matters will not have a material adverse effect on our consolidated financial position, results of operations, or liquidity.
Item 4. Mine Safety Disclosures.
None.
31
Item 5. Market for Registrant's Common Equity, Related Stockholder Matters and Issuer Purchases of Equity Securities.
Market Information
Our common stock has been quoted on the Nasdaq Global Market or the Nasdaq Global Select Market under the symbol "CLNE" since May 25, 2007. Prior to that time, there was no public market for our stock. Set forth below are the high and low sales prices as reported by the Nasdaq Global Market for our common stock for the periods indicated.
|
|
Sales Prices | ||||||
|---|---|---|---|---|---|---|---|
|
|
High | Low | |||||
Fiscal Year 2013 |
|||||||
First Quarter 2013 |
$ | 14.48 | $ | 12.03 | |||
Second Quarter 2013 |
$ | 14.30 | $ | 12.01 | |||
Third Quarter 2013 |
$ | 13.46 | $ | 12.26 | |||
Fourth Quarter 2013 |
$ | 13.79 | $ | 11.23 | |||
Fiscal Year 2014 |
|||||||
First Quarter 2014 |
$ | 12.78 | $ | 8.37 | |||
Second Quarter 2014 |
$ | 11.72 | $ | 8.70 | |||
Third Quarter 2014 |
$ | 11.63 | $ | 7.80 | |||
Fourth Quarter 2014 |
$ | 7.43 | $ | 4.30 | |||
Holders
There were approximately 58 stockholders of record as of February 19, 2015. We believe there are approximately 75,899 additional stockholders whose shares of our common stock are held on their behalf by brokerage firms or other agents.
Dividend Policy
We have not paid any dividends to date and do not anticipate paying any dividends on our common stock in the foreseeable future. Further, the SLG Agreements (as defined and described in note 9 to our consolidated financial statements included in this report), restrict our ability to pay cash dividends on our common stock. We anticipate that all future earnings will be retained to finance future growth.
Performance Graph
This performance graph shall not be deemed "filed" for purposes of Section 18 of the Exchange Act, or incorporated by reference into any filing of Clean Energy Fuels Corp. under the Securities Act or the Exchange Act, except as shall be expressly set forth by specific reference in such filing.
The following graph shows a comparison for the five-year period ending December 31, 2014 of the cumulative total return for our common stock, the Nasdaq Global Market Index, and the Russell 2000 Growth Index, in each case assuming $100 was invested on December 31, 2009. We chose to include the Russell 2000 Growth Index as a comparable index due to the lack of a comparable industry index or peer group, as we are the only actively traded public company whose only line of business is to sell natural gas and the associated equipment and services necessary to use natural gas as a vehicle fuel. Such returns are based on historical results and are not intended to suggest future performance. Data for the Nasdaq Global Market Index and the Russell 2000 Growth Index assumes reinvestment of dividends.
32
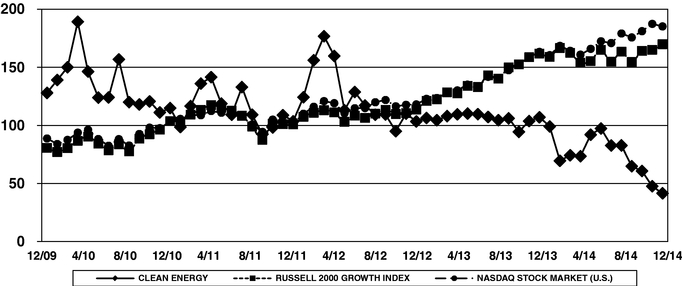
Item 6. Selected Financial Data.
You should read the following selected historical consolidated financial data in conjunction with "Management's Discussion and Analysis of Financial Condition and Results of Operations" and our consolidated financial statements and the related notes included in this annual report on Form 10-K.
The consolidated statements of operations data for the years ended December 31, 2012, 2013, and 2014 and the consolidated balance sheet data at December 31, 2013, and 2014, are derived from our audited consolidated financial statements included in this annual report on Form 10-K. The consolidated statements of operations data for the years ended December 31, 2010 and 2011, and the consolidated balance sheet data at December 31, 2010, 2011 and 2012 are derived from our audited consolidated financial statements that are not included in this annual report on Form 10-K. The
33
historical results are not necessarily indicative of the results to be expected in the current period or any future period.
|
|
Year Ended December 31, | |||||||||||||||
|---|---|---|---|---|---|---|---|---|---|---|---|---|---|---|---|---|
|
|
2010 | 2011 | 2012 | 2013 | 2014 | |||||||||||
|
|
(In thousands, except share data) |
|||||||||||||||
Statement of Operations Data: |
||||||||||||||||
Total Revenues(1) |
$ | 211,834 | $ | 292,717 | $ | 334,008 | $ | 352,475 | $ | 428,940 | ||||||
Operating expenses: |
||||||||||||||||
Costs of sales (exclusive of depreciation and amortization shown separately below) |
141,889 | 216,684 | 253,684 | 224,762 | 308,787 | |||||||||||
Derivative (gains) losses: |
||||||||||||||||
Series I warrant valuation |
(10,278 | ) | (2,655 | ) | (3,391 | ) | (938 | ) | (5,748 | ) | ||||||
Selling, general and administrative |
63,258 | 86,850 | 117,976 | 138,024 | 126,435 | |||||||||||
Depreciation and amortization |
22,487 | 30,406 | 36,261 | 42,318 | 49,058 | |||||||||||
Impairment of long-lived intangible definite lived assets |
| | | | 4,772 | |||||||||||
| | | | | | | | | | | | | | | | | |
Total operating expenses: |
217,356 | 331,285 | 404,530 | 404,166 | 483,304 | |||||||||||
| | | | | | | | | | | | | | | | | |
Operating loss |
(5,522 | ) | (38,568 | ) | (70,522 | ) | (51,691 | ) | (54,364 | ) | ||||||
Interest expense, net |
(1,194 | ) | (9,616 | ) | (16,069 | ) | (29,287 | ) | (44,357 | ) | ||||||
Other income (expense), net |
2,080 | (611 | ) | 1,236 | (970 | ) | (2,571 | ) | ||||||||
Impairment of cost method investment |
| | (14,544 | ) | | | ||||||||||
Income (loss) from equity method investments |
427 | 637 | 331 | (76 | ) | (490 | ) | |||||||||
Gain from sale of equity method investment |
| | | 4,705 | | |||||||||||
Gain from sale of subsidiary |
| | | 14,115 | 11,998 | |||||||||||
| | | | | | | | | | | | | | | | | |
Loss before income taxes |
(4,209 | ) | (48,158 | ) | (99,568 | ) | (63,204 | ) | (89,784 | ) | ||||||
Income tax (expense) benefit |
1,436 | 703 | (1,294 | ) | (3,715 | ) | (1,075 | ) | ||||||||
| | | | | | | | | | | | | | | | | |
Net loss |
(2,773 | ) | (47,455 | ) | (100,862 | ) | (66,919 | ) | (90,859 | ) | ||||||
Income (loss) of noncontrolling interest |
(257 | ) | 178 | 393 | 49 | (1,200 | ) | |||||||||
| | | | | | | | | | | | | | | | | |
Net loss attributable to Clean Energy Fuels Corp |
$ | (2,516 | ) | $ | (47,633 | ) | $ | (101,255 | ) | $ | (66,968 | ) | $ | (89,659 | ) | |
| | | | | | | | | | | | | | | | | |
| | | | | | | | | | | | | | | | | |
| | | | | | | | | | | | | | | | | |
Basic and diluted loss per share |
$ | (0.04 | ) | $ | (0.68 | ) | $ | (1.16 | ) | $ | (0.71 | ) | $ | (0.96 | ) | |
| | | | | | | | | | | | | | | | | |
| | | | | | | | | | | | | | | | | |
| | | | | | | | | | | | | | | | | |
Weighted average common share outstanding: |
||||||||||||||||
Basic and diluted |
62,549,311 | 70,415,431 | 87,455,073 | 93,958,758 | 93,678,432 | |||||||||||
| | | | | | | | | | | | | | | | | |
| | | | | | | | | | | | | | | | | |
| | | | | | | | | | | | | | | | | |
- (1)
- Revenues include the following amounts:
|
|
Year Ended December 31, | |||||||||||||||
|---|---|---|---|---|---|---|---|---|---|---|---|---|---|---|---|---|
|
|
2010 | 2011 | 2012 | 2013 | 2014 | |||||||||||
Alternative fuel tax credits (VETC) |
$ | 16,042 | $ | 17,889 | $ | (2,057) | (a) | $ | 45,439 | (b) | $ | 28,359 | ||||
| | | | | | | | | | | | | | | | | |
| | | | | | | | | | | | | | | | | |
| | | | | | | | | | | | | | | | | |
- (a)
- Represents settlement with the Internal Revenue Service over certain VETC amounts.
34
- (b)
- Amount includes $20,800 related to 2012.
|
|
December 31, | |||||||||||||||
|---|---|---|---|---|---|---|---|---|---|---|---|---|---|---|---|---|
|
|
2010 | 2011 | 2012 | 2013 | 2014 | |||||||||||
Balance Sheet Data: |
||||||||||||||||
Cash and cash equivalents |
$ | 55,194 | $ | 238,125 | $ | 108,522 | $ | 240,033 | $ | 92,381 | ||||||
Restricted cash, short term |
2,500 | 4,792 | 8,445 | 8,403 | 6,012 | |||||||||||
Short-term investments |
| 33,329 | 38,175 | 138,240 | 122,546 | |||||||||||
Working capital |
65,070 | 312,372 | 170,778 | 400,990 | 293,428 | |||||||||||
Total assets |
583,499 | 931,061 | 975,200 | 1,250,965 | 1,160,409 | |||||||||||
Long-term debt, inclusive of current portion |
64,416 | 289,422 | 331,025 | 620,418 | 570,670 | |||||||||||
Total Clean Energy Fuels Corp. Stockholders' equity |
413,287 | 540,884 | 542,713 | 514,572 | 437,426 | |||||||||||
Item 7. Management's Discussion and Analysis of Financial Condition and Results of Operations.
The discussion in this section contains forward-looking statements. These statements relate to future events or our future financial performance and are based upon our current assumptions, expectations and beliefs concerning future developments and their potential effect on our business. We have attempted to identify forward-looking statements by terminology such as "anticipate," "believe," "can," "continue," "ongoing," "could," "estimate," "expect," "intend," "may," "plan," "potential," "predict," "project," "forecast," "should," "would" or "will" or the negative of these terms or other comparable terminology, but their absence does not mean that a statement is not forward-looking. These statements are only predictions and involve known and unknown risks, uncertainties and other factors, which could cause our actual results to differ from those projected in any forward-looking statements we make. See "Risk Factors" in Part I, Item 1A of this annual report on Form 10-K for a discussion of some of these risks and uncertainties. This discussion should be read with our financial statements and related notes included in this report.
We are the leading provider of natural gas as an alternative fuel for vehicle fleets in the United States and Canada, based on the number of stations operated and the amount of gasoline gallon equivalents ("GGEs")of compressed natural gas ("CNG") and liquefied natural gas ("LNG") delivered. We design, build, operate and maintain fueling stations and supply our customers with CNG fuel for light, medium and heavy-duty vehicles and LNG fuel for medium and heavy-duty vehicles. We also manufacture, sell and service non-lubricated natural gas fueling compressors and other equipment used in CNG stations and LNG stations, provide operation and maintenance ("O&M") services to customers, offer assessment, design and modification solutions to provide operators with code-compliant service and maintenance facilities for natural gas vehicle fleets, transport and sell CNG to large industrial and institutional energy users who do not have direct access to natural gas pipelines, process and sell renewable natural gas ("RNG"), which can be used as vehicle fuel or sold for renewable power generation, and sell tradable credits we generate by selling natural gas and RNG as a vehicle fuel, including credits we generate under the California Low Carbon Fuel Standard ("LCFS Credits") and Renewable Identification Numbers ("RIN Credits" or "RINs") we generate under the federal Renewable Fuel Standard ("RFS") Phase 2, and help our customers acquire and finance natural gas vehicles and obtain local, state and federal grants and incentives.
Overview
This overview discusses matters on which our management primarily focuses in evaluating our financial condition and operating performance and results.
35
Sources of Revenue.
We generate revenues by selling CNG and LNG, providing O&M services to our vehicle fleet customers, designing and constructing fueling stations and selling those stations to our customers, processing and selling RNG, selling non-lubricated natural gas fueling compressors and related equipment and maintenance services for CNG and LNG fueling stations, offering assessment, design and modification solutions designed to provide operators with code- compliant service and maintenance facilities for natural gas vehicle fleets, transporting and selling CNG to large industrial and institutional energy users who do not have direct access to natural gas pipelines, providing financing for our customers' natural gas vehicle purchases and selling tradable credits, including LCFS Credits and RIN Credits. In addition, through June 28, 2013, we generated revenues, through BAF, by selling converted natural gas vehicles and providing design and engineering services for natural gas engine systems.
Key Operating Data.
In evaluating our operating performance, our management focuses primarily on: (1) the amount of CNG and LNG gasoline gallon equivalents delivered (which we define as (i) the volume of gasoline gallon equivalents we sell to our customers, plus (ii) the volume of gasoline gallon equivalents dispensed to our customers at stations where we provide O&M services, but do not sell the CNG or LNG, plus (iii) our proportionate share of the gasoline gallon equivalents sold as CNG by our joint venture in Peru (through March 2013 when we sold our interest in the joint venture in Peru), plus (iv) our proportionate share of the gasoline gallon equivalents of RNG produced and sold as pipeline quality natural gas by our RNG production facilities), (2) our gross margin (which we define as revenue minus cost of sales), and (3) net income (loss) attributable to us. The following table, which you should read in conjunction with our consolidated financial statements and notes included in this annual report on Form 10-K, presents our key operating data for the years ended December 31, 2012, 2013, and 2014:
|
|
Year Ended December 31, | |||||||||
|---|---|---|---|---|---|---|---|---|---|---|
|
|
2012 | 2013 | 2014 | |||||||
Gasoline gallon equivalents delivered (in millions) |
||||||||||
CNG |
130.5 | 143.9 | 182.6 | |||||||
RNG |
8.9 | 10.5 | 12.2 | |||||||
LNG |
55.5 | 60.0 | 70.3 | |||||||
| | | | | | | | | | | |
Total |
194.9 | 214.4 | 265.1 | |||||||
| | | | | | | | | | | |
| | | | | | | | | | | |
| | | | | | | | | | | |
Other Operating data (in thousands) |
||||||||||
Gross margin |
$ | 80,324 | $ | 127,713 | (1) | $ | 120,153 | (1) | ||
Net loss attributable to Clean Energy Fuels. Corp |
(101,255 | ) | (66,968) | (1) | (89,659) | (1) | ||||
- (1)
- Includes $28.4 million and $45.4 million of revenue for federal fuel tax credits ("VETC") for the years ended December 31, 2104 and 2013, respectively. See the discussion under "OperationsVETC" below.
Key Trends in 2012, 2013 and 2014.
According to the U.S. Department of Energy, Energy Information Administration ("EIA"), demand for natural gas fuels in the United States increased by approximately 52% during the period January 1, 2011 through December 31, 2014. We believe this growth in demand was attributable primarily to the higher prices of gasoline and diesel relative to CNG and LNG during much of this
36
period, as well as increasingly stringent environmental regulations affecting vehicle fleets and increased availability of natural gas.
The number of fueling stations we owned, operated, maintained and/or supplied grew from 348 at January 1, 2012 to over 545 at December 31, 2014 (a 57.7% increase). Included in this number are all of the CNG and LNG fueling stations we own, operate, maintain or with which we have a fueling supply contract. The amount of CNG, RNG, and LNG gasoline gallon equivalents we delivered from 2012 to 2014 increased by 36%. The increase in gasoline gallon equivalents delivered was the primary contributor to increased revenues during 2012, 2013 and 2014. In addition, in 2013 and 2014, revenues included VETC revenues of $45.4 million and $28.4 million, respectively , with the 2013 VETC revenues including $20.8 million related to 2012 due to the reinstatement of VETC in January 2013. A portion of the increase in revenue in 2014 was attributable to an increase in the number of fueling stations we constructed and sold to our customers. Our revenue can vary between periods for various reasons, including the timing of equipment sales, station construction and natural gas sale activity.
Our fuel cost of sales also increased during these periods, which was attributable primarily to increased costs related to delivering more CNG, RNG and LNG to our customers in 2012 through 2014. Our cost of sales can vary between periods for various reasons, including the timing of equipment sales, station construction and natural gas sale activity.
During 2013 and 2014, prices for oil, gasoline, and diesel fuel were generally substantially higher than the price for natural gas. Oil hit a high of $105.37 per barrel, or $19.11 per one million British thermal units ("MMbtu"), in June 2014 and was $54.53 per barrel, or $9.89 per MMbtu, on December 31, 2014. In California, the average retail price for gasoline was $3.89 per gallon in 2013, hit a high of $4.30 per gallon in April 2014, and was $2.73 per gallon at December 31, 2014. The average retail price for diesel fuel in California was $4.13 per diesel gallon in 2013, hit a high of $4.14 per diesel gallon in April 2014, and was $3.36 per diesel gallon at December 31, 2014. During the same period, the NYMEX price for natural gas ranged from $3.35 per MMbtu in January 2013 to $4.30 per MMbtu in December 2014. The average retail sales price of our CNG fuel sold in the Los Angeles metropolitan area ranged from $2.75 per gallon for the month of January 2013 to $2.46 per gallon for the month of December 2014. The average retail sales price of our LNG fuel sold in the Los Angeles metropolitan area ranged from $2.70 per gallon during January 2013 to $2.54 per gallon for the month of December 2014. Higher gasoline and diesel prices improve our margins on fuel sales to the extent we price our fuel at a relatively consistent discount to gasoline or diesel and natural gas prices do not increase by a corresponding amount.
Recent Developments.
In January 2014, we completed the purchase of 67 CNG-In-A-Box units, which consist of relatively small, turnkey self-contained CNG stations, from Peake Fuel Solutions, L.L.C. for $18.4 million.
In March 2014, our subsidiary Canton Renewables, LLC ("Canton") completed the issuance of Solid Waste Facility Limited Obligation Revenue Bonds (Canton Renewables, LLCSauk Trail Hills Project) Series 2014 (the "Bonds") in the aggregate principal amount of $12.4 million.
In September 2014, we formed a joint venture with Mansfield Energy Corp. ("Mansfield") called Mansfield Clean Energy Partners LLC ("MCEP"), which will provide natural gas fueling solutions to bulk fuel haulers in the U.S. MCEP's first customer is Mansfield Oil Company, one of the nation's largest providers of transportation fuel and an affiliate of Mansfield, whose fleet of CNG trucks will fuel at a new Atlanta, Georgia, area public natural gas station built by MCEP and opened in November 2014. MCEP expects to develop additional public-access natural gas fueling stations throughout the U.S.
37
In October 2014, we purchased common units representing a majority interest of NG Advantage LLC ("NG Advantage") for $37.7 million. NG Advantage is engaged in the business of transporting CNG in high-capacity trailers to large industrial and institutional energy users, such as hospitals, food processors, manufacturers and paper mills, which do not have direct access to natural gas pipelines. We expect to sell increasing volumes of CNG to such customers. In addition, we purchased from NG Advantage a CNG station located in Milton, Vermont for $9.0 million. NG Advantage used a portion of the transaction proceeds to repay debt and expects to use a substantial majority of the remaining proceeds to purchase CNG tanker trailers and for capital expenditures and working capital purposes.
In December 2014, the VETC of $0.50 per gasoline gallon equivalent of CNG and $0.50 per liquid gallon of LNG that is sold as a vehicle fuel was extended through December 31, 2014 and made retroactive to January 1, 2014. The program providing or the VETC had previously expired as of December 31, 2013. All VETC revenues for 2014, totaling $28.4 million, were recognized in December 2014.
Also in December 2014, we completed our sale of our entire interest in Dallas Clean Energy LLC ("DCE") to Cambrian Energy McCommas Bluff LLC ("Cambrian"). DCE owns all of the equity interests in Dallas Clean Energy McCommas Bluff, LLC ("DCEMB"), and DCEMB owns an RNG extraction and processing project at the McCommas Bluff landfill in Dallas, Texas. We previously indirectly owned, through our wholly owned subsidiary Mavrix LLC ("Mavrix"), a 70% interest in DCE, sold 19% of such interest to Cambrian in September 2014, and sold all of our remaining interest in December 2014. As consideration for the sale of DCE, we received $7.0 million in cash in September 2014 and $40.6 million in cash in December 2014 and we may receive up to an additional $3.0 million in cash on or before August 14, 2015, subject to the results of certain performance tests to be performed at the McCommas Bluff project on or before such date. We will continue to have the right to market and sell biomethane produced at the McCommas Bluff project under our Redeem renewable natural gas vehicle fuel brand.
In connection with our sale of DCE and DCEMB, in December 2014, Mavrix delivered $13.6 million of the cash proceeds it received from Cambrian as payment in full of all outstanding indebtedness under the Note Purchase Agreement dated as of April 25, 2013 (the "NPA") and a related secured promissory note (the "Note"). Concurrently with such payment, the NPA, the Note and all other documents related thereto were terminated in full.
Also in December 2014, we, through two wholly owned subsidiaries (the "Borrowers"), amended our credit agreement (the "Credit Agreement") with General Electric Capital Corporation ("GE") , which we entered into on November 7, 2012 and which provides us the ability to borrow up to an aggregate of $200.0 million to finance the development, construction and operation of two LNG production facilities, subject to our satisfaction of certain conditions on or before December 31, 2014. The amendment to the Credit Agreement, among other things, extends our obligation to satisfy such conditions and draw the loans from December 31, 2014 to December 31, 2016. In connection with the amendment to the Credit Agreement, we also amended a warrant to purchase five million shares of our common stock that we originally issued to GE concurrently with the execution of the Credit Agreement, to accelerate the exercisability of 0.5 million shares thereunder to December 31, 2014 (See note 11 to our consolidated financial statements).
Anticipated Future Trends.
We anticipate that, over the long term, the prices for gasoline and diesel will continue to be higher than the price of natural gas as a vehicle fuel, which will continue to make natural gas vehicle fuel an attractive alternative to gasoline and diesel. Our belief that natural gas will continue, over the long
38
term, to be a cheaper vehicle fuel than gasoline or diesel is based in large part on the growth in United States natural gas production in recent years.
We believe there will be significant growth in the consumption of natural gas as a vehicle fuel among vehicle fleets, and our goal is to capitalize on this trend if and to the extent it materializes and enhance our leadership position if and as the market expands. With our acquisitions in 2010 of the natural gas compressor development and manufacturing business of IMW Industries, Ltd. ("IMW") and Wyoming Northstar Incorporated and its affiliated entities (collectively, "Northstar"), a leading provider of station design, construction, operation and maintenance services, and our acquisition in 2013 of Mansfield Gas Equipment Systems Corporation ("MGES"), a provider of CNG station design and construction and related services, we are a fully integrated provider of advanced compression technology, CNG and LNG station design and construction, and CNG and LNG fueling. We anticipate expanding our sales of CNG, RNG and LNG in each of the markets in which we operate, including trucking, refuse, airports, ready mix, taxis and public transit, and plan to enter additional markets, including potentially rail. Consistent with the anticipated growth of our business, we also expect that our operating costs and capital expenditures will increase, primarily from the anticipated expansion of our station network and LNG and RNG production capacity, as well as the logistics of delivering more CNG, LNG and RNG to our customers. We also anticipate that we will continue to seek to acquire assets and/or businesses that are in the natural gas fueling infrastructure or RNG production business that may require us to raise and expend additional capital. Additionally, we have increased, and will continue to increase, our personnel as we seek to expand our existing markets and enter new markets, which will also result in increased costs.
We have made a significant commitment of capital and other resources to build a nationwide network of natural gas truck-friendly fueling stations, which we refer to as "America's Natural Gas Highway" or "ANGH ." Many of our existing ANGH stations were initially built to provide LNG; however, because operators are adopting LNG heavy-duty trucks and CNG heavy-duty trucks, we designed such stations to be capable of dispensing both fuels. We have been investing, and expect to continue to invest, additional capital in our ANGH stations to add CNG fueling. To help accelerate the adoption by heavy-duty truck fleets of natural gas, we have partnered with GE's Transportation Finance business to make loans and leases, including fair market value leases, available to fleet operators. We have also negotiated favorable CNG and LNG tank pricing from manufacturers, which we are passing along to our customers.
Some ANGH stations are located at Pilot Flying J Travel Centers ("Pilot"), one of the largest truck fueling operators in the U.S. Under our agreement with Pilot, we own the ANGH stations we build at Pilot locations and initially pay rent to Pilot for the use of its property. In addition, we are entitled to recoup all of our capital investments in ANGH stations we build at Pilot locations plus a defined return, after which we share a portion of the station profits with Pilot.
Sources of Liquidity and Anticipated Capital Expenditures.
Liquidity is the ability to meet present and future financial obligations either through operating cash flows, the sale or maturity of existing assets, or by the acquisition of additional funds through capital management. Historically, our principal sources of liquidity has consisted of cash on hand and cash provided by financing activities.
Our business plan calls for approximately $58.3 million in capital expenditures in 2015, primarily related to construction of fueling stations and the purchase of CNG trailers (these trailers are expected to be purchased by NG Advantage, and we anticipate that NG Advantage will use a portion of the purchase price we paid for our interest in that entity to fund such purchase). We may also elect to invest additional amounts in companies or assets in the natural gas fueling infrastructure and services and production industries, including RNG production, to make capital expenditures to secure future
39
LNG supply, and to use capital for other activities or pursuits. We will need to raise additional capital as necessary to fund any capital expenditures or investments that we cannot fund through available cash or cash generated by operations. The timing and necessity of any future capital raise will depend on various factors, including our rate of new station construction and any potential merger or acquisition activity, and other factors described under "Liquidity and Capital Resources" below. We may not be able to raise capital, when needed, on terms that are favorable to us or existing stockholders or at all. Any inability to raise capital may impair our ability to invest in new stations, develop natural gas fueling infrastructure and invest in strategic transactions or acquisitions and may reduce our ability to grow our business and generate sustained or increased revenues.
Business Risks and Uncertainties.
Our business and prospects are exposed to numerous risks and uncertainties. For more information, see "Risk Factors" in Part I, Item 1A of this report.
Operations
We generate revenues principally by selling CNG, LNG and RNG and providing O&M services to our vehicle fleet customers. For the year ended December 31, 2014, CNG and RNG (together) represented 73% and LNG represented 27% of our natural gas sales (on a gasoline gallon equivalent basis). To a lesser extent, we generate revenues by designing and constructing fueling stations and selling or leasing those stations to our customers. We also generate revenues through sales of non-lubricated natural gas fueling compressors and related equipment and maintenance services, providing assessment, design and modification solutions to provide vehicle fleet operators with code-compliant service and maintenance facilities for natural gas vehicle fleets, providing financing for our customers' natural gas vehicle purchases, transporting and selling of CNG to large industrial and institutional energy users who do not have direct access to natural gas pipelines, selling RINs and LCFS Credits, and receiving federal fuel tax credits.
CNG Sales
We sell CNG through fueling stations and by transporting it to customers without direct access to a natural gas pipeline. CNG fueling station sales are made through stations located on our customers' properties and through our network of public access fueling stations. At these CNG fueling stations, we procure natural gas from local utilities or third-party marketers under standard, floating-rate arrangements and then compress and dispense it into our customers' vehicles. Our CNG fueling station sales are made primarily through contracts with our customers. Under these contracts, pricing is principally determined on an index-plus basis, which is calculated by adding a margin to the local index or utility price for natural gas. CNG sales revenues based on an index-plus methodology increase or decrease as a result of an increase or decrease in the price of natural gas. Our customers typically are billed monthly based on the volume of CNG sold at a station. The remainder of our CNG sales fueling station sales are on a per fill-up basis at prices we set at public access stations based on prevailing market conditions.
Additionally, our subsidiary, NG Advantage, uses a fleet of 45 trailers to deliver CNG to large institutions and industrial energy users, such as hospitals, food processors, manufacturers and paper mills, that do not have direct access to natural gas pipelines. Utilizing its fleet of high-capacity tube trailers, NG Advantage creates a "virtual natural gas pipeline" that allows large oil, diesel or propane users to take advantage of the cost savings and environmental benefits of natural gas. We anticipate that NG Advantage will need to purchase or lease additional trailers to transport CNG in support of its operations.
40
LNG Production and Sales
We obtain LNG from our own plants as well as through relationships with suppliers. We own and operate LNG liquefaction plants near Houston, Texas and Boron, California, we plan to expand the production capacity of the Boron, California plant, and we have obtained a commitment from GE to, subject to our satisfaction of certain conditions, partially finance our purchase of two new LNG plants to be built by an affiliate of GE (see note 9 to our consolidated financial statements). We expect that expanding existing plants or building new plants, including plants built and operated by us or by third parties, will be necessary to secure sufficient sources of LNG in the future.
We sell LNG on a bulk basis to fleet customers, who often own and operate their fueling stations, and we also sell LNG to fleet and other customers at our public access LNG stations. Further, we sell LNG for non-vehicle purposes, including to customers who use LNG in the oil fields or for industrial applications or power storage. During 2013 and 2014, we procured 33% and 44%, respectively, of our LNG from third-party producers, and we produced the remainder of the LNG at our liquefaction plants in Texas and California. For LNG that we purchase from third parties, we have entered into "take or pay" contracts that require us to purchase minimum volumes of LNG at index-based rates. We expect to enter additional purchase contracts with third party LNG producers in the future to support our LNG supply needs, some of which may be "take or pay" contracts. We deliver LNG via our fleet of 84 tanker trailers to fueling stations, where it is stored and dispensed in liquid form into vehicles. We anticipate that we will need to purchase or lease additional tanker trailers to transport LNG, and that we will need to increase the number of third parties who provide us contract carrier services. We sell LNG through supply contracts that are priced on an index-plus basis. LNG sales revenues based on an index-plus methodology increase or decrease as a result of an increase or decrease in the price of natural gas. We also sell LNG on a per fill-up basis at prices we set at public access stations based on prevailing market conditions. LNG generally costs more than CNG as LNG must be liquefied and transported, and the federal government imposes higher fuel taxes on LNG.
VETC
From October 1, 2006 through December 31, 2011, we were eligible to receive a VETC of $0.50 per gasoline gallon equivalent of CNG and $0.50 per liquid gallon of LNG that we sold as vehicle fuel. Based on the service relationship with our customers, either we or our customers claimed the credit. We recorded these tax credits as revenues in our consolidated statements of operations, as the credits are fully refundable and do not need to offset tax liabilities to be received. As such, the credits are not deemed income tax credits under the accounting guidance applicable to income taxes. In addition, we believe the credits are properly recorded as revenue because we often incorporate the tax credits into our pricing with our customers, thereby lowering the actual price per gallon we charge them.
The American Taxpayer Relief Act, signed into law on January 2, 2013, reinstated VETC for calendar year 2013 and also made it retroactive to January 1, 2012. The Tax Increase Prevention Act, signed into law in December 2014, reinstated VETC for the remainder of calendar year 2014 and made it retroactive to January 1, 2014. VETC revenues recognized during 2013 and 2014 were $45.4 and $28.4 million, respectively. The VETC revenues received during 2013 include $20.8 million related to CNG and LNG that we sold in 2012, which was recognized in January 2013, and all VETC revenues received in 2014 were recognized in December 2014.
Operation and Maintenance
We generate a portion of our revenue from our performance of O&M services for CNG and LNG fueling stations. For these services we generally charge a per-gallon fee based on the volume of fuel dispensed at the station. We include the volume of fuel dispensed at the stations at which we provide O&M services in our calculation of aggregate gasoline gallon equivalents delivered.
41
Station Construction and Engineering
We generate a portion of our revenue from designing and constructing fueling stations and selling or leasing some of the stations to our customers. For these projects, we act as general contractor or supervise qualified third-party contractors. We also offer assessment, design and modification solutions to provide vehicle fleet operators with code-compliant service and maintenance facilities for natural gas vehicle fleets, which can include the construction and sale of facility modifications, including our NGV Easy Bay system, a natural gas vapor leak barrier developed specifically for natural gas vehicle facilities. We charge construction or other fees or lease rates based on the size and complexity of the project.
RNG
We own an RNG production facility located at a Republic Services landfill in Canton, Michigan. This facility was completed in 2012, and we have entered into a ten-year fixed-price sale contract for the majority of the RNG that we expect the facility to produce. We built another RNG production facility at a Republic Services landfill in North Shelby, Tennessee. We are seeking to expand our RNG business by pursuing additional RNG production projects, either on our own or with project partners. We sell some of the RNG we produce, and expect to sell a significant amount of the RNG we produce at the facilities we are building and plan to build, through our natural gas fueling infrastructure for use as a vehicle fuel. In addition, we purchase RNG from third party producers, and sell that RNG for vehicle use through our fueling infrastructure. The RNG we sell for vehicle fuel use is distributed under the name Redeem. On December 29, 2014, we sold our full ownership interest in our DCE subsidiary for approximately $40.6 million and may receive up to an additional $3.0 million in cash on or before August 14, 2015, subject to the results of certain performance tests to be performed at the project on or before August 1, 2015. For the years ended December 31, 2013 and 2014, DCE contributed approximately $15.7 million and $16.7 million, respectively, to our revenue.
Natural Gas Fueling Compressors
Our subsidiary, IMW, manufactures, sells and services non-lubricated natural gas fueling compressors and related equipment for the global natural gas fueling market. IMW is headquartered near Vancouver, British Columbia, has an additional manufacturing facility near Shanghai, China, and has sales and service offices in Bangladesh, Colombia, Peru and the U.S. For the years ended December 31, 2013 and 2014, IMW contributed approximately $77.5 million and $84.8 million, respectively, to our revenue.
Sales of RINs and LCFS Credits
We generate LCFS Credits when we sell RNG and conventional natural gas for use as a vehicle fuel in California, and we generate RIN Credits when we sell RNG for use as a vehicle fuel. We can sell these credits to third parties who need the RINs and LCFS Credits to comply with federal and state requirements. In 2013, we realized $4.8 million and $3.8 million in revenue through the sale of LCFS Credits and RIN Credits, respectively. In 2014, we realized $3.5 million and $2.1 million in revenue through the sale of LCFS Credits and RIN Credits, respectively. We anticipate that we will generate and sell increasing numbers of RINs and LCFS Credits as we grow our business and sell increasing amounts of CNG, LNG and RNG for use as a vehicle fuel. The market for RINs and LCFS Credits is volatile, and the prices for such credits may be subject to significant fluctuations. Further, the value of RINs and LCFS Credits will be adversely affected by any changes to the state and federal programs under which such credits are generated and sold.
42
Vehicle Acquisition and Finance
We offer vehicle finance services for some of our customers' purchases of natural gas vehicles. We loan to certain qualifying customers a portion, and on occasion up to 100%, of the purchase price of their natural gas vehicles. We may also lease natural gas vehicles to certain of our customers in the future. Where appropriate, we apply for and receive state and federal incentives associated with natural gas vehicle purchases and pass these benefits through to our customers. We may also secure vehicles to place with customers or pay deposits with respect to such vehicles prior to receiving a firm order from our customers, which we may be required to purchase if our customer fails to purchase the vehicle as anticipated. Through December 31, 2014, we have not generated significant income from vehicle financing activities.
Vehicle Conversions
Prior to June 28, 2013, we owned BAF Technologies, Inc., a provider of natural gas vehicle conversions, alternative fuel systems, application engineering, service and warranty support and research and development. BAF owned ServoTech Engineering, Inc. ("ServoTech" and, together with BAF Technologies, Inc., "BAF"), which provided, among other services, design and engineering services for natural gas engine systems. We generated revenues through the sale of natural gas vehicles that had been converted to run on natural gas by BAF, and design and engineering services for natural gas engine systems by ServoTech. For the year ended December 31, 2013, BAF contributed approximately $7.0 million to our revenue. On June 28, 2013, we sold our ownership interest in BAF and its ServoTech subsidiary for approximately $27.2 million.
Volatility of Earnings and Cash Flows Related to Derivative Activities
During 2012 and 2013 our futures contracts qualified for hedge accounting, so we had no derivative gains or losses recognized in our consolidated statements of operations for these periods. We did not enter into or otherwise have in effect any futures contracts during 2014. In accordance with our natural gas hedging policy, we plan to structure all futures contracts as cash flow hedges under the applicable derivative accounting guidance, but we cannot be certain that they will qualify. See "Risk Management Activities" below. If any of our futures contracts do not qualify for hedge accounting, we could incur significant increases or decreases in our earnings based on fluctuations in the market value of these contracts from period to period.
Additionally, we are required to maintain a margin account to cover losses related to any existing natural gas futures contracts. Futures contracts are valued daily, and if our contracts are in loss positions at the end of a trading day, our broker will transfer the amount of the losses from our margin account to a clearinghouse. If at any time the funds in our margin account drop below a specified maintenance level, our broker will issue a margin call that requires us to restore the balance. Consequently, these payments could significantly impact our cash balances. At December 31, 2014, we had no margin deposits or futures contracts in place.
Volatility of Earnings Related to Series I Warrants
Under Financial Accounting Standards Board ("FASB") authoritative guidance, we are required to record the change in the fair market value of our Series I warrants in our consolidated financial statements. We have recognized a gain of $0.9 million and $5.7 million, respectively, related to recording the estimated fair value changes of our Series I warrants in 2013 and 2014. See note 18 to our consolidated financial statements. Our earnings or loss per share may be materially affected by future gains or losses we are required to recognize as a result of valuing our Series I warrants. As of December 31, 2014, 2,130,682 of the Series I warrants remained outstanding.
43
Debt Compliance
The loan agreements relating to the 7.5% Notes, as defined and discussed in note 9 to our consolidated financial statements, have certain non-financial debt covenants with which we must comply. As of December 31, 2014, we were in compliance with these debt covenants.
The convertible note purchase agreements relating to the SLG Notes, as defined and discussed in note 9 to our consolidated financial statements, have certain non-financial debt covenants with which we must comply. As of December 31, 2014, we were in compliance with these covenants.
The Credit Agreement, as discussed in note 9 to our consolidated financial statements, contains certain covenants with which we must comply. As of December 31, 2014, we were in compliance with these covenants.
The indenture relating to the 5.25% Notes, as defined and discussed in note 9 to our consolidated financial statements, has certain non-financial debt covenants with which we must comply. As of December 31, 2014, we were in compliance with these debt covenants.
The Bonds, as discussed in note 9 to our consolidated financial statements, contain certain debt covenants with which we must comply. As of December 31, 2014, we were in compliance with these debt covenants.
Risk Management Activities
From time to time, we enter into natural gas fuel sales contracts that require us to sell LNG or CNG to our customers at a fixed price. These contracts expose us to the risk that the price of natural gas may increase above the natural gas cost component included in the price at which we are committed to sell the natural gas to our customers.
In an effort to mitigate the volatility of our earnings related to any futures contracts and to reduce our risk related to our fixed price sales contracts, we operate under a natural gas hedging policy pursuant to which we only purchase futures contracts to hedge our exposure to variability in expected future cash flows related to a particular fixed price contract or bid. Subject to the conditions set forth in the policy, we purchase futures contracts in quantities reasonably expected to effectively hedge our exposure to cash flow variability related to fixed price sales contracts entered into after the date of the policy. Unless otherwise agreed in advance by our board of directors and the derivatives committee thereof, we will conduct our futures contract activities and enter into fixed price sales contracts only in accordance with the natural gas hedging policy, a complete copy of which, as amended effective May 29, 2008, is filed as Exhibit 99.1 to our Form 8-K filed with the Securities and Exchange Commission on June 20, 2008. The summary of the policy described above does not purport to be complete and is qualified in its entirety by reference to the full text of the policy.
Due to the restrictions of our hedging policy, we expect to offer fewer fixed price sales contracts to our customers. If we do offer a fixed price sales contract, we anticipate including a price component that would cover our estimated cash requirements over the duration of the underlying futures contracts. The amount of this price component will vary based on the anticipated volume and the natural gas price component to be covered under the fixed price sales contract.
Critical Accounting Policies
Our discussion and analysis of our financial condition and results of operations is based upon our consolidated financial statements, which have been prepared in accordance with U.S. generally accepted accounting principles ("US GAAP"). The preparation of financial statements requires management to make estimates and assumptions that affect the reported amounts of assets and liabilities and
44
disclosures of contingent assets and liabilities at the date of the financial statements, and revenues and expenses recorded during the reporting periods.
On a periodic basis, we evaluate our estimates, including those related to revenue recognition, asset realization, accounts receivable reserves, notes receivable reserves, warranty reserves, derivative values, income taxes, and the fair value of equity instruments granted as stock-based compensation. We use historical experience, market quotes, and other assumptions as the basis for making estimates. Actual results could differ from those estimates under different assumptions or conditions. We believe the following critical accounting policies affect our more significant judgments and estimates used in the preparation of our consolidated financial statements.
Impairment of Goodwill and Long-Lived Assets
The fair value of assets acquired and liabilities assumed in a business acquisition are recognized at the acquisition date, with amounts exceeding the fair values being recognized as goodwill. Goodwill is not amortized. Instead, it is tested for impairment on an annual basis or more frequently whenever events or changes in circumstances indicate that goodwill may be impaired. We perform our annual impairment test as of the first day of our fourth fiscal quarter. We either use qualitative factors to determine whether goodwill is more likely than not to be impaired or we perform a two-step approach to quantify impairment. The qualitative assessment includes assessing the potential impact on a reporting unit's fair value of certain events and circumstances, including our market capitalization value, macroeconomic conditions, industry and market considerations, cost factors, and other relevant entity-specific events. If we conclude from the qualitative assessment that goodwill is more likely than not to be impaired, then we follow the two-step approach to quantify the impairment. We are required to use judgment when applying the goodwill impairment test, including the identification of reporting units, assignment of assets and liabilities to reporting units, assignment of goodwill to reporting units, and determination of the fair value of each reporting unit. In addition, the estimates used to determine the fair value of each reporting unit may change based on results of operations, estimation of future cash flows, which is dependent on internal forecasts, estimation of the long-term rate of growth for our business, estimation of the useful life over which cash flows will occur, terminal values, if applicable, the determination of our weighted average cost of capital, which helps determine the discount rate, and macroeconomic conditions or other factors. Changes in these estimates could materially affect our assessment of fair value and goodwill impairment.
We test tangible and intangible long-lived assets with definite useful lives for impairment whenever circumstances or events may affect the recoverability of the long-lived assets. The evaluation is primarily dependent on the estimated future cash flows of the assets and the fair value of these items, as determined by management based on a number of estimates, including future cash flow projections, discount rates and terminal values. In determining these estimates, management considers internally generated information and information obtained from discussions with market participants. The determination of fair value requires significant judgment by both management and outside experts engaged to assist in this process.
There were no long-lived asset impairments in 2013. In the fourth quarter of 2014, we recorded impairment to an intangible asset contract, acquired at the time of the IMW acquisition, in the amount of $4.8 million.
Warranty Reserves
Our warranty periods range up to twelve months, depending on the product or service. We provide a warranty reserve for estimated product warranty costs at the time the applicable sale is recognized. We continuously monitor and analyze warranty claims and maintain a reserve for the related warranty costs based on historical experience, or failure rates, and future assumptions. If actual failure rates and
45
the resulting cost of repair vary from our estimates, revisions to the estimated warranty reserve would be required.
Revenue Recognition
We recognize revenue on our CNG, LNG and RNG gas sales and for our O&M services in accordance with US GAAP, which requires that four basic criteria must be met before revenue can be recognized: (1) persuasive evidence of an arrangement exists; (2) delivery has occurred and title and the risks and rewards of ownership have been transferred to the customer or services have been rendered; (3) the price is fixed or determinable; and (4) collectability is reasonably assured. Applying these factors, we typically recognize revenue from the sale of natural gas fuel at the time it is dispensed or, in the case of LNG sales agreements, delivered to our customers' storage facilities. We recognize revenue from O&M agreements as we provide the related services.
In certain transactions with our customers, we agree to provide multiple products or services, including construction of and sale of a station, providing O&M services to the station, and sale of fuel to the customer. We evaluate the separability of revenues based on current FASB authoritative guidance, which provides a framework for establishing whether or not a particular arrangement with a customer has one or more revenue elements and allows us to use a combination of internal and external objective and reliable evidence to develop management's best estimate of the fair value of the contract elements. If the arrangement contains a lease, we use the existing evidence of fair value to separate the lease from the other elements in the arrangement. The arrangement's consideration that is fixed or determinable is then allocated to each separate unit of accounting based on the estimated relative selling price of each deliverable, which is determined based on the historical data derived from our stand -alone projects. The revenue allocated to the construction of the station is recognized using the completed-contract method. The revenue allocated to the O&M is recognized ratably over the term of the arrangement and sale of fuel is recognized as the fuel is delivered.
We recognize revenue related to our leasing activities in accordance with current FASB authoritative guidance. Our existing station leases are sales- type leases, giving rise to profit at the delivery of the leased station. Unearned revenue is amortized into income over the life of the lease using the effective-interest method. For those arrangements, we recognize gas sales and O&M service revenues as earned from the customer on a volume-delivered basis.
We typically recognize revenue on fueling station construction projects where we sell the station to the customer using the completed-contract method. The construction contract is considered to be substantially completed at the earlier of customer acceptance of the fueling station or the time when the fuel dispensing activities begin. When applicable, multi-station construction contracts are segmented into phases as negotiated with customers. Gross margin related to each phase is recognized at its substantial completion. For IMW and Northstar, we use the percentage-of-completion method of accounting. In these circumstances, revenue is recognized as work on a contract progresses, based on costs incurred in relation to total estimated costs to be incurred for that project.
We generate LCFS Credits when we sell RNG and conventional natural gas for use as a vehicle fuel in California, and we generate RIN Credits when we sell RNG for use as a vehicle fuel. We can sell these credits to third parties who need the RINs and LCFS Credits to comply with federal and state emission requirements. We recognize revenue from the generation of these credits at the time we have an agreement in place to sell the credits at a fixed or determinable price.
46
Stock-Based Compensation
We recognize compensation expense related to all stock-based payment arrangements, net of an estimated forfeiture rate, over the requisite service period of the award. For stock options and restricted stock units, we recognize compensation expense based on the grant date fair value. Our assessment of the estimated fair value of stock options granted is affected by our stock price as well as assumptions regarding a number of complex and subjective variables and the related tax impact. We use the Black-Scholes option pricing model to estimate the fair value of stock options granted. The Black-Scholes option pricing model was developed for use in estimating the fair value of traded options that have no vesting restrictions and are fully transferable. This model also requires the input of certain assumptions, including: the expected volatility of our common stock price, expected dividends, if any, expected life of the stock option, and the risk free interest rate appropriate for the expected holding period. For grants of restricted stock units, we determine the grant date fair value based on the closing market price of our common stock on the date of grant.
Income Taxes
We compute income taxes under the asset and liability method. This method requires the recognition of deferred tax assets and liabilities for temporary differences between the financial carrying amounts and the tax bases of our assets and liabilities. The impact on deferred taxes of changes in tax rates and laws, if any, are applied to the years during which temporary differences are expected to be settled and are reflected in the consolidated financial statements in the period of enactment. We record a valuation allowance against any deferred tax assets when management determines it is more likely than not that the assets will not be realized. When evaluating the need for a valuation analysis, we use estimates involving a high degree of judgment including projected future book income and the amounts and estimated timing of the reversal of any deferred tax assets and liabilities.
We operate within multiple domestic and foreign taxing jurisdictions and are subject to audit in these jurisdictions. These audits can involve complex issues, which may require an extended period of time for resolution. Although we believe that adequate consideration has been given to such issues, it is possible that the ultimate resolution of such issues could be significantly different than originally estimated.
Fair Value Estimates
We have established a framework for measuring fair value in accordance with authoritative guidance. The framework includes a hierarchy for inputs used in measuring fair value that maximizes the use of observable inputs and minimizes the use of unobservable inputs by requiring that the most observable inputs be used when available. Observable inputs are inputs market participants would use in valuing the asset or liability developed based on market data obtained from sources independent of our Company. Unobservable inputs are inputs that reflect our assumptions about the factors market participants would use in valuing the asset or liability developed based upon the best information available in the circumstances. The hierarchy consists of the following three levels: Level 1 inputs are quoted prices (unadjusted) in active markets for identical assets or liabilities; Level 2 inputs include quoted prices for similar assets or liabilities in active markets, quoted prices for identical or similar assets or liabilities in markets that are not active, and inputs (other than quoted prices) that are observable for the asset or liability, either directly or indirectly; Level 3 inputs are unobservable inputs for the asset or liability. Categorization within the valuation hierarchy is based upon the lowest level of input that is significant to the fair value measurement.
Our significant uses of fair value measurements include:
-
- Recorded values of available-for-sale securities,
47
-
-
Allocation of the purchase price paid to acquire businesses to the assets acquired and liabilities assumed in those acquisitions,
-
-
Assessments of impairment of long-lived assets,
-
-
Assessments of impairment of goodwill,
-
- Recorded values of certain warrants to purchase our common stock.
Inputs into the determination of the fair value of certain warrants to purchase our common stock include the current market price of our common stock, exercise price of the warrants, volatility of our stock price, term of the warrants, and discount rate used. Significant changes in any of those inputs in isolation can result in a significant change in the fair value measurement. Generally, a positive change in the market price of our common stock, an increase in the volatility of our common stock, or an increase in the remaining term of the warrant would result in a directionally similar change in the estimated fair value of the warrants and thus an increase in the associated liability. An increase in the assumed discount rate or a decrease in the positive differential between the warrant's exercise price and the market price of our common stock would result in a decrease in the estimated fair value measurement of the warrants and thus a decrease in the associated liability.
Recently Adopted Accounting Changes and Recently Issued and Adopted Accounting Standards
See note 1 to our consolidated financial statements.
Results of Operations
Fiscal Year Ended December 31, 2014 Compared to Fiscal Year Ended December 31, 2013
Revenue. Revenue increased by $76.4 million to $428.9 million in the year ended December 31, 2014, from $352.5 million in the year ended December 31, 2013. A portion of this increase was the result of an increase in the number of gallons delivered between periods, from 214.4 million gasoline gallon equivalents to 265.1 million gasoline gallon equivalents. The increase in volume was primarily from an increase in CNG sales of 38.7 million gallons. Our net increase in CNG volume was primarily from 26 new refuse customers, 16 new transit customers, five new airport customers, and four new trucking customers, which together accounted for 18.4 million gallons of the CNG volume increase, and an additional 4.6 million CNG gallons sold as a result of our acquisition and purchase of a CNG station from NG Advantage in 2014. We also experienced an increase of 20.7 million gallons in CNG volume between periods from our existing airport, refuse and trucking customers. These CNG gallon increases were offset by a decline of 2.2 million gallons associated with the sale of our 49% interest in our Peruvian joint venture in March 2013 and 2.8 million gallons related to the loss of three CNG O&M stations for one transit customer. Further, we experienced an increase of 10.3 million gallons in LNG volume between periods, which was primarily due to 7.1 million gallons from 15 new refuse, transit, trucking and industrial customers, and 3.2 million gallons from existing trucking, refuse, transit and industrial customers. We experienced a 1.7 million gallons increase between periods in our RNG sales, primarily due to increased RNG production at our facilities in Canton, Michigan and North Shelby, Tennessee. The increase was offset by a decrease in RNG sales at our Dallas, Texas facility, which was sold in December 2014 in connection with the sale of our interest in DCE. Revenue attributable to the design and construction of fueling stations and code-compliant maintenance facilities sold to our customers increased by $40.3 million between periods, primarily due to completion of 16 new CNG stations for new refuse, airport, transit and industrial customers and 18 upgrades for CNG stations for existing refuse and transit customers. Revenue attributable to IMW increased between periods by $7.3 million. Our effective price per gallon charged was $0.92 for the year ended December 31, 2014, which represents a $0.03 per gallon increase from $0.89 in the year ended December 31, 2013. The increase was primarily due to higher natural gas prices in 2014, upon which
48
we base a portion of our pricing to our customers. The increases in revenues were offset by a $17.0 million decrease in VETC revenue primarily due to our recording of $20.8 million of 2012 VETC revenue in the first quarter of 2013 as a result of legislation passed in January 2013 that retroactively reinstated the fuel tax credit to January 1, 2012. Additionally, we experienced a decrease of $7.0 million in the sales of natural gas vehicle equipment and emission control services by BAF between periods due to the sale of BAF in June 2013.
Cost of sales. Cost of sales increased by $84.0 million to $308.8 million in the year ended December 31, 2014, from $224.8 million in the year ended December 31, 2013. The increase was primarily due to increased costs related to delivering and servicing more volume to our customers. Our effective cost per gallon increased by $0.07 per gallon, from $0.58 per gallon in 2013 to $0.65 per gallon in 2014. This increase was primarily the result of higher natural gas and LNG delivery costs between periods. Additionally, station construction costs increased by $33.9 million between periods as station construction sales increased between periods. Also contributing to the cost of sales increase was a $10.3 million increase in costs related to IMW primarily due to increased sales between periods and higher manufacturing costs related to equipment sold for a mining power project in Australia during 2014. These increases were offset by a $6.8 million decrease in costs related to BAF's vehicle equipment sales and emission control services, as we sold BAF in June 2013.
Derivative (gain) loss on Series I warrant valuation. Derivative gains increased by $4.8 million to $5.7 million in the year ended December 31, 2014, from $0.9 million in the year ended December 31, 2013. These amounts represent the non-cash impact with respect to valuing our outstanding Series I warrants based on our mark-to-market accounting for the warrants during the periods (see note 18 to our consolidated financial statements).
Selling, general and administrative. Selling, general and administrative expenses decreased by $11.6 million to $126.4 million in the year ended December 31, 2014, from $138.0 million in the year ended December 31, 2013. The decrease is primarily attributable to a decrease in our stock based compensation expense of $11.5 million in 2014. In addition, we experienced decreases in travel and entertainment expenses of $2.1 million, decreases in natural gas policy and promotion expenses of $1.6 million, decreases in costs related to vacating in 2013 our former offices in Seal Beach, California of $1.6 million and decreases in research and development costs of $0.3 million. These decreases were offset by an increase in our salaries and employee benefits by $5.4 million between periods, primarily due to higher average salaries and benefits per employee in 2014 compared to 2013, as we increased our operations, production and engineering headcount by 44 and hired more management level positions between periods to help support America's Natural Gas Highway and our continued business expansion. A portion of the increase in our salaries and employee benefits is due to $1.3 million in retirement benefits related to the retirement of our former Chief Marketing Officer in 2014 and $0.6 million in severance costs related to the departure of our former Chief Financial Officer in 2014. Additionally, in the fourth quarter of 2014, we recorded impairment to an intangible asset contract acquired at the time of the IMW acquisition in an amount of $4.8 million.
Depreciation and amortization. Depreciation and amortization increased by $6.8 million to $49.1 million in the year ended December 31, 2014, from $42.3 million in the year ended December 31, 2013. This increase was primarily due to additional depreciation expense in 2014 related to increased property and equipment balances between periods, which primarily resulted from our expanded station network, including our efforts to build-out America's Natural Gas Highway.
Interest expense, net. Interest expense, net, increased by $15.1 million to $44.4 million for the year ended December 31, 2014, from $29.3 million for the year ended December 31, 2013. This increase was primarily the result of an increase in interest expense related to the $50.0 million of convertible notes we issued in June 2013, the $250.0 million of convertible notes we issued in September 2013, the aggregate $15.0 million advanced under the Note in April, September and December 2013, and the
49
$12.4 million Bonds issued in March 2014. An early termination fee of $0.8 million, incurred upon our repayment in full of the Note in connection with the sale of DCE, and additional debt issuance costs of $0.9 million associated with the issuance of the Bonds were also expensed and included in interest expense in 2014 (see note 9 to our consolidated financial statements for a description of our outstanding debt).
Other income (expense), net. Other income (expense), net, increased by ($1.6) million to ($2.6) million for the year ended December 31, 2014, from ($1.0) million for the year ended December 31, 2013. This increase was primarily due to foreign currency exchange rate changes between periods on our IMW customer deposits held in foreign currencies.
Loss from equity method investment. Losses from our equity method investments increased by $0.4 million to $0.5 million for the year ended December 31, 2014, compared to a loss of $0.1 million for the year ended December 31, 2013. This increase was primarily due to losses from our MCEP joint venture, which was formed in September 2014. During 2013, we recorded $0.1 million of equity in the loss of our 49% interest in our Peruvian joint venture. We completed the sale of our interest in our Peruvian joint venture in March 2013.
Gain from sale of equity method investment. During 2013, we recorded a $4.7 million gain from the sale of our 49% interest in our Peruvian joint venture.
Gain from sale of subsidiary. During 2014, we recorded a gain of $12.0 million from the sale of DCE. During 2013, we recorded a $14.1 million gain from the sale of our former subsidiary, BAF.
Income tax expense. Income tax expense decreased by $2.6 million to $1.1 million for the year ended December 31, 2014 compared to $3.7 million for the year ended December 31, 2013. The decrease is primarily attributable to a decrease in our tax on foreign operations between periods, which in 2013 included $1.4 million of taxes that arose from the sale of Clean Energy del Peru.
Loss (income) of noncontrolling interest. During the years ended December 31, 2014 and 2013, we recorded $1.2 million and $0 million, respectively, for the noncontrolling interest in the net income of DCE and NG Advantage. The noncontrolling interests represent the 46.7% noncontrolling interest in NG Advantage upon our acquisition of a 53.3% interest in NG Advantage in October 2014, and the 30% interest of our joint venture partner in DCE until September 2014 when we sold 19% of DCE to our joint venture partner, which increased its interest from 30% to 49%. In December 2014, we sold our remaining 51% ownership interest in DCE to the joint venture partner.
Fiscal Year Ended December 31, 2013 Compared to Fiscal Year Ended December 31, 2012
Revenue. Revenue increased by $18.5 million to $352.5 million in the year ended December 31, 2013, from $334.0 million in the year ended December 31, 2012. A portion of this increase was the result of an increase in the number of gallons delivered between periods, from 194.9 million gasoline gallon equivalents to 214.4 million gasoline gallon equivalents. The increase in volume was primarily from an increase in CNG sales of 13.4 million gallons. Our net increase in CNG volume was primarily from 28 new refuse customers, eight new airport customers, five new transit customers, and one new trucking customer, which together accounted for 7.1 million gallons of the CNG volume increase. We also experienced an increase of 14.5 million gallons in CNG volume between periods from our existing airport, refuse and trucking customers. These CNG gallon increases were offset by a decline of 6.8 million gallons associated with the sale of our 49% interest in our Peruvian joint venture in March 2013 and 1.4 million gallons related to the loss of three CNG O&M stations for one transit customer. Further, we experienced an increase of 4.5 million gallons in LNG volume between periods, which was primarily due to 1.1 million gallons from seven new refuse, transit, trucking and industrial customers, and 4.8 million gallons from existing trucking, refuse, transit and industrial customers. These LNG
50
gallon increases were offset by a decrease of 1.4 million gallons from one existing transit customer that is in the process of transitioning to CNG buses, and who will continue to be our customer. We experienced a 1.6 million gallons increase between periods in our RNG sales, primarily due to increased RNG production at DCEMB's facility and RNG production at our facility in Canton, Michigan that began in December 2012. Revenue attributable to VETC increased by $47.5 million between periods, including $20.8 million related to recording all of the 2012 VETC revenue in the first quarter of 2013 as a result of legislation passed in January 2013 that retroactively reinstated the fuel tax credit to January 1, 2012 and extended such credit to December 31, 2013. We recorded a $2.1 million reduction in VETC revenue in 2012 related to the settlement of our dispute with the Internal Revenue Service over certain VETC claims. Revenue attributable to IMW increased between periods by $13.0 million. Our effective price per gallon charged was $0.89 for the year ended December 31, 2013, which represents a $0.07 per gallon increase from $0.82 in the year ended December 31, 2012. The increase was primarily due to higher natural gas prices in 2013, upon which we base a portion of our pricing to our customers. LCFS and RIN Credit revenues also increased by $1.9 million between periods, primarily due to increased rates for the credits between periods. These increases were offset by a $17.3 million decrease in the sales of natural gas vehicle equipment and emission control services by BAF between periods due to the sale of BAF in June 2013. We also experienced a $57.7 million decrease in station construction revenue between periods, primarily due to the sale in 2012 of four large CNG stations to an existing transit customer that did not reoccur in 2013.
Cost of sales. Cost of sales decreased by $28.9 million to $224.8 million in the year ended December 31, 2013, from $253.7 million in the year ended December 31, 2012. Station construction costs decreased by $56.5 million between periods as station construction sales decreased between periods. Also contributing to the cost of sales decrease was an $11.8 million decrease in costs related to BAF's vehicle equipment sales and emission control services, as we sold BAF in June 2013. These decreases were offset by the increased costs related to delivering and servicing more volume to our customers. Also offsetting the cost of sales decreases between periods was the increase in our effective cost per gallon. Our effective cost per gallon increased by $0.06 per gallon, from $0.52 per gallon in 2012 to $0.58 per gallon for 2013. This increase was primarily the result of higher natural gas and LNG delivery costs between periods. Cost of sales at IMW increased between periods by $15.3 million primarily due to its increased sales between periods.
Derivative (gain) loss on Series I warrant valuation. Derivative gains decreased by $2.5 million to $0.9 million in the year ended December 31, 2013, from $3.4 million in the year ended December 31, 2012. These amounts represent the non-cash impact with respect to valuing our outstanding Series I warrants based on our mark-to-market accounting for the warrants during the periods (see note 18 to our consolidated financial statements).
Selling, general and administrative. Selling, general and administrative expenses increased by $20.0 million to $138.0 million in the year ended December 31, 2013, from $118.0 million in the year ended December 31, 2012. Salaries and employee benefits increased by $4.5 million between periods, primarily due to higher average salaries and benefits per employee in 2013 compared to 2012, as we increased our sales force by 36 and hired more management level positions between periods to help support America's Natural Gas Highway and our continued business expansion. Also related to our expansion, we experienced a $6.9 million increase in consulting, legal, accounting and professional, business insurance, rent and occupancy, and natural gas policy and promotion expenses between periods. Further contributing to the increase between periods was the effect of recording $3.0 million of lower gains on the IMW contingent consideration in 2013 and an increase in our stock based compensation expense of $0.9 million in 2013. We also incurred moving expenses related to the move of our corporate headquarters to Newport Beach, California and costs related to vacating the offices we leased in Seal Beach, California, which amounted to $2.9 million. Our travel and entertainment
51
expenses increased by $1.8 million between periods, primarily due to the increased travel of our sales team to develop new customers in the heavy-duty truck market.
Depreciation and amortization. Depreciation and amortization increased by $6.0 million to $42.3 million in the year ended December 31, 2013, from $36.3 million in the year ended December 31, 2012. This increase was primarily due to additional depreciation expense in 2013 related to increased property and equipment balances between periods, which primarily resulted from our expanded station network, including our efforts to build-out America's Natural Gas Highway.
Interest expense, net. Interest expense, net, increased by $13.2 million to $29.3 million for the year ended December 31, 2013, from $16.1 million for the year ended December 31, 2012. This increase was primarily the result of an increase in interest expense related to the $50.0 million of convertible notes we issued in July 2012, the $50.0 million of convertible notes we issued in June 2013, the aggregate $15.0 million advanced under the Note in April, September and December 2013, and the $250.0 million of convertible notes we issued in September 2013 (see note 9 to our consolidated financial statements for a description of our outstanding debt).
Other income (expense), net. Other income (expense), net, decreased by $2.2 million to $(1.0) million of expense for the year ended December 31, 2013, compared to income of $1.2 million for the year ended December 31, 2012. This decrease was primarily due to foreign currency exchange rate changes between periods on our IMW purchase notes (see note 9 to the consolidated financial statements).
Income (loss) from equity method investment. During 2013, we recorded $0.1 million of equity in the loss of our 49% interest in our Peruvian joint venture, compared to $0.3 million of equity in the income in 2012. We completed the sale of our interest in our Peruvian joint venture in March 2013.
Gain from sale of equity method investment. During 2013, we recorded a $4.7 million gain from the sale of our 49% interest in our Peruvian joint venture.
Gain from sale of subsidiary. During 2013, we recorded a $14.1 million gain from the sale of our former subsidiary, BAF.
Income tax expense. Income tax expense increased by $2.4 million to $3.7 million for the year ended December 31, 2013 compared to $1.3 million for the year ended December 31, 2012. The increase was primarily attributable to an increase in our tax on foreign operations between periods.
Loss (income) of noncontrolling interest. During the years ended December 31, 2013 and 2012, we recorded $0 million and $(0.4) million, respectively, for the noncontrolling interest in the net income of DCE. The noncontrolling interest represented the 30% interest of our joint venture partner in 2013.
Seasonality and Inflation
To some extent, we experience seasonality in our results of operations. Natural gas vehicle fuel amounts consumed by some of our customers tend to be higher in summer months when buses and other fleet vehicles use more fuel to power their air conditioning systems. Natural gas commodity prices tend to be higher in the fall and winter months due to increased overall demand for natural gas for heating during these periods.
Since our inception, inflation has not significantly affected our operating results. However, costs for construction, repairs, maintenance, electricity and insurance are all subject to inflationary pressures and could affect our ability to maintain our stations adequately, build new stations, build new LNG plants or expand our existing facilities, or could materially increase our operating costs.
52
Liquidity and Capital Resources
We require cash to fund our capital expenditures, operating expenses and working capital requirements, including outlays for the design and construction of new fueling stations, construction, expansion and maintenance of LNG production facilities, the purchase of new CNG tanker trailers, investment in RNG production, manufacture of natural gas fueling compressors and related equipment, mergers and acquisitions, the financing of natural gas vehicles for our customers and general corporate purposes, including making deposits to support our derivative activities, geographic expansion (domestically and internationally), expanding our sales and marketing activities, support of legislative and regulatory initiatives and for working capital. Our principal sources of liquidity are cash on hand and cash provided by financing activities.
Liquidity
Cash used in operating activities was $76.0 million in 2014, compared to $4.7 million in 2013. A significant portion of this change is attributable to the timing of our collection of VETC revenues. In 2013, we collected $38.5 million in VETC revenues related to natural gas sales made in 2012 and 2013, and in 2014 we collected $6.9 million in VETC revenues related to natural gas sales made in 2013. VETC revenues for 2014, totaling $28.4 million, were recorded in December 2014 but were not available for collection during 2014 and are expected to be collected in 2015. The increase in net cash used in operating activities from 2013 to 2014 was also due to an increase of $17.1 million in interest paid during 2014, primarily related to $306.4 million in debt, net of debt issuance costs, issued in mid to late 2013 that was outstanding for all of 2014. Additionally, cash flows used in operating activities increased between periods by approximately $27.6 million as a result of timing differences associated primarily with our station construction receivables.
Cash used in investing activities was $46.9 million in 2014, compared to $155.0 million in 2013. A significant portion of this decrease is due to a net decrease of $91.9 million in cash used for the purchase of short-term investments during 2014 compared to 2013. During 2014, we had net maturities of short-term investments of $14.3 million, compared to net purchases of short-term investments of $77.6 million during 2013, principally related to our receipt and investment of net proceeds from our debt issuances of $306.4 million in 2013 compared to $11.9 million in 2014. Contributing further to the decrease in cash used in investing activities was our receipt of $39.8 million in cash net proceeds from the sale of our subsidiary DCE in 2014, compared to our receipt of $1.2 million in cash in 2013 in connection with the sale of our former subsidiary BAF. The decrease in cash used in investing activities from 2013 to 2014 was offset by a net increase of $2.4 million in loans we made to our customers, net of payments and proceeds from sales of such loans, to assist them in purchasing natural gas vehicles.
Cash used in financing activities in 2014 was $25.8 million, compared to cash provided by financing activities of $290.7 million in 2013. This change was principally due to a decrease in the net proceeds we received from the issuance of debt instruments during 2014 compared to 2013. In 2014, we received proceeds of $11.9 million, net of debt issuance costs, related to the issuance of the Bonds, compared to proceeds of $306.4 million, net of debt issuance costs, received in 2013 related to the issuance of some of the 7.5% Notes, the Note, and the 5.25% Notes. The decrease is also attributable to our payment of the outstanding balance of approximately $15.2 million under the Note in connection with our sale of DCE in 2014, our payment of long-term debt balances of approximately $12.2 million related to the NG Advantage acquisition in 2014, and our payment of $3.3 million more in cash on the IMW Notes in 2014 compared to 2013. The decrease in cash provided by financing activities from 2013 to 2014 was offset by cash proceeds of approximately $7.0 million received from our sale of 19% of our ownership interest in DCE in September 2014. See note 9 to our consolidated financial statements for definitions and descriptions of all of our outstanding debt instruments.
53
Our financial position and liquidity are, and will be, influenced by a variety of factors, including our ability to generate cash flows from operations, the level of our outstanding indebtedness and the principal and interest we are obligated to pay on our indebtedness, our capital expenditure requirements (which consist primarily of station construction costs, LNG plant construction, expansion and maintenance costs, RNG plant construction and maintenance costs and the purchase of LNG and CNG tanker trailers and equipment) and any merger or acquisition activity.
Sources of Cash
Historically, our principal sources of liquidity have consisted of cash on hand and cash provided by financing activities. At December 31, 2014 we had total cash and cash equivalents and short-term investments of $214.9 million, compared to $378.3 million at December 31, 2013.
On November 7, 2012, we, through the Borrowers, entered into the Credit Agreement with GE. Pursuant to the agreement, GE agreed to loan to the Borrowers up to an aggregate of $200.0 million to finance the development, construction and operation of two LNG plants, subject to our satisfaction of certain conditions on or before December 31, 2014. In December 2014, we amended the Credit Agreement to, among other things, extend our obligation to satisfy such conditions and draw the loans from December 31, 2014 to December 31, 2016.
On April 25, 2013, Mavrix entered into the NPA, pursuant to which the purchaser thereunder purchased the Note in the maximum aggregate principal amount of $30.0 million and, in each of April, September and December of 2013, drew $5.0 million under the Note. In December 2014, we paid all amounts owed under the Note in connection with our sale of all of our interest in DCE and DCEMB.
On June 14, 2013, Boone Pickens and Green Energy Investment Holdings, LLC delivered $50.0 million to us in satisfaction of a funding requirement under the 7.5% Notes.
In September 2013, we completed a private offering of the 5.25% Notes. The net proceeds from the sale of the 5.25% Notes after the payment of certain debt issuance costs of $7.8 million were approximately $242.2 million, which we have used, and intend to continue to use, to fund capital expenditures and for general corporate purposes.
On March 19, 2014, Canton completed the issuance of the Bonds in the aggregate principal of $12.4 million. The proceeds are being used primarily to (i) refinance the cost of constructing and equipping its RNG extraction and production project in Canton, Michigan and (ii) pay a portion of the cost associated with the issuance of the Bonds.
Please see note 9 to our consolidated financial statements for a description of all of our outstanding debt.
Capital Expenditures
Our business plan calls for approximately $58.3 million in capital expenditures in 2015, primarily related to construction of fueling stations and the purchase of CNG trailers (these trailers are expected to be purchased by NG Advantage, and we anticipate that NG Advantage will use a portion of the purchase price we paid for our interest in that entity to fund such purchase). We may also elect to invest additional amounts in companies or assets in the natural gas fueling infrastructure and services and production industries, including RNG production, to make capital expenditures to secure future LNG supply, and to use capital for other activities or pursuits. We will need to raise additional capital as necessary to fund any capital expenditures or investments that we cannot fund through available cash or cash generated by operations. The timing and necessity of any future capital raise will depend on various factors, including our rate of new station construction and any potential merger or acquisition activity, and other factors described under "Liquidity and Capital Resources" above. We may seek to raise additional capital we need through one or more sources, including, among others, selling assets,
54
obtaining new or restructuring existing debt, or obtaining equity capital, or any combination of these or other available sources of capital. We may not be able to raise capital when needed on terms that are favorable to us or existing stockholders, or at all. Any inability to raise capital may impair our ability to invest in new stations, develop natural gas fueling infrastructure and invest in strategic transactions or acquisitions and may reduce our ability of to grow our business and generate sustained or increased revenues.
Contractual Obligations
The following represents the scheduled maturities of our contractual obligations as of December 31, 2014:
|
|
Payments Due by Period | |||||||||||||||
|---|---|---|---|---|---|---|---|---|---|---|---|---|---|---|---|---|
Contractual Obligations:
|
Total | Less than 1 year | 1 - 3 years | 3 - 5 years | More than 5 years |
|||||||||||
Long-term debt and capital lease obligations(a) |
$ | 700,140 | $ | 42,248 | $ | 211,955 | 386,862 | $ | 59,075 | |||||||
Operating lease commitments(b) |
59,418 | 10,343 | 16,616 | 10,501 | 21,958 | |||||||||||
Long-term "take or pay" LNG purchase contracts(c) |
13,114 | 4,628 | 8,486 | | | |||||||||||
Construction contracts(d) |
18,949 | 18,949 | | | | |||||||||||
| | | | | | | | | | | | | | | | | |
Total |
$ | 791,621 | $ | 76,168 | $ | 237,057 | $ | 397,363 | $ | 81,033 | ||||||
| | | | | | | | | | | | | | | | | |
| | | | | | | | | | | | | | | | | |
| | | | | | | | | | | | | | | | | |
- (a)
- Consists
of long-term debt and capital lease obligations to finance acquisitions and equipment purchases, including interest.
- (b)
- Consists
of various space and ground leases for our California LNG plant, offices and fueling stations as well as leases for equipment.
- (c)
- The
amounts in the table represent our estimates for one long-term fixed "take-or-pay" LNG purchase commitment contract.
- (d)
- Consists of our obligations to fund various fueling station construction projects, net of amounts funded through December 31, 2014, and excluding contractual commitments related to station sales contracts.
Off-Balance Sheet Arrangements
At December 31, 2014, we had the following off-balance sheet arrangements that had, or are reasonably likely to have, a material effect on our financial condition:
-
-
outstanding surety bonds for construction contracts and general corporate purposes totaling $45.2 million ;
-
-
one long-term take-or-pay contract for the purchase of LNG; and
-
- operating leases where we are the lessee.
We provide surety bonds primarily for construction contracts in the ordinary course of business, as a form of guarantee. No liability has been recorded in connection with our surety bonds as we do not believe, based on historical experience and information currently available, that it is probable that any amounts will be required to be paid under these arrangements for which we will not be reimbursed.
We have one long-term take-or-pay contract that requires us to purchase minimum volumes of LNG at index based prices and expires in October 2017.
55
We have entered into operating lease arrangements for certain equipment and for our office and field operating locations in the ordinary course of business. The terms of our leases expire at various dates through 2021. Additionally, in November 2006, we entered into a ground lease for 36 acres in California on which we built our California LNG liquefaction plant. The lease is for an initial term of thirty years and requires payments of $0.2 million per year, plus up to $0.1 million per year for each 30 million gallons of production capacity utilized, subject to future adjustment based on consumer price index changes. We must also pay a royalty to the landlord for each gallon of LNG produced at the facility, as well as a fee for certain other services that the landlord provides.
Item 7A. Quantitative and Qualitative Disclosures about Market Risk.
In the ordinary course of business, we are exposed to various market risk factors, including changes in general economic conditions, domestic and foreign competition, commodity price risk and foreign currency exchange rates.
Commodity Risk.
We are subject to market risk with respect to our sales of natural gas, which have historically been subject to volatile market conditions. Our exposure to market risk is heightened when we have a fixed price sales contract with a customer that is not covered by a futures contract, or when we are otherwise unable to pass through natural gas price increases to customers. Natural gas prices and availability are affected by many factors, including weather conditions, overall economic conditions and foreign and domestic governmental regulation and relations.
Natural gas costs represented 25% (or 31% excluding BAF, IMW and Northstar) of our cost of sales for 2013 and 26% (or 31% excluding IMW and Northstar) of our cost of sales for 2014.
To reduce price risk caused by market fluctuations in natural gas, we may enter into exchange traded natural gas futures contracts. These arrangements expose us to the risk of financial loss in situations where the other party to the contract defaults on the contract or there is a change in the expected differential between the underlying price in the contract and the actual price of natural gas we pay at the delivery point. We did not have any futures contracts outstanding at December 31, 2014.
Foreign Exchange Rate Risk.
Because we have foreign operations, we are exposed to foreign currency exchange gains and losses. Since the functional currency of our foreign operations is in their local currency, the currency effects of translating the financial statements of those foreign subsidiaries, which operate in local currency environments, are included in the accumulated other comprehensive income (loss) component of consolidated equity in our consolidated financial statements and do not impact earnings. However, foreign currency transaction gains and losses not in our subsidiaries' functional currency do impact earnings and resulted in approximately $2.6 million of loss in 2014. During 2014, our primary exposure to foreign currency rates related to our Canadian operations that had certain outstanding accounts receivable and accounts payable denominated in the U.S. dollar which were not hedged.
We have prepared a sensitivity analysis to estimate our exposure to market risk with respect to our monetary transactions denominated in a foreign currency. If the exchange rate on these assets and liabilities were to fluctuate by 10% from the rate as of December 31, 2014, we would expect a corresponding fluctuation in the value of the assets and liabilities of approximately $1.8 million.
56
Item 8. Financial Statements and Supplementary Data.
Quarterly Results of Operations
The following table sets forth our quarterly consolidated statements of operations data for the eight quarters ended December 31, 2014. The information for each quarter is unaudited and we have prepared the information on the same basis as the audited consolidated financial statements included in this annual report on Form 10-K. This information includes all adjustments that management considers necessary for the fair presentation of such data. The quarterly data should be read together with our consolidated financial statements and related notes included in this annual report on Form 10-K. The results of operations for any one quarter are not necessarily indicative of results for the current period or any future period.
Quarterly Financial Data (Unaudited)
(In thousands, except share data)
|
|
For the Quarter Ended | ||||||||||||
|---|---|---|---|---|---|---|---|---|---|---|---|---|---|
|
|
March 31, 2013 |
June 30, 2013 |
September 30, 2013 |
December 31, 2013 |
|||||||||
Revenue: |
|||||||||||||
Product revenues |
$ | 83,483 | $ | 78,375 | $ | 75,389 | $ | 73,566 | |||||
Service revenues |
9,560 | 9,741 | 10,932 | 11,429 | |||||||||
| | | | | | | | | | | | | | |
Total revenues |
93,043 | 88,116 | 86,321 | 84,995 | |||||||||
Operating expenses: |
|||||||||||||
Cost of sales (exclusive of depreciation and amortization shown separately below): |
|||||||||||||
Product cost of sales |
46,814 | 58,925 | 51,941 | 55,913 | |||||||||
Service cost of sales |
3,927 | 3,016 | 2,866 | 1,360 | |||||||||
Derivative (gains) losses: |
|||||||||||||
Series I warrant valuation |
466 | 39 | (1,366 | ) | (77 | ) | |||||||
Selling, general and administrative |
32,876 | 35,187 | 33,511 | 36,450 | |||||||||
Depreciation and amortization |
10,158 | 10,777 | 10,924 | 10,459 | |||||||||
| | | | | | | | | | | | | | |
Total operating expenses |
94,241 | 107,944 | 97,876 | 104,105 | |||||||||
| | | | | | | | | | | | | | |
Operating loss |
(1,198 | ) | (19,828 | ) | (11,555 | ) | (19,110 | ) | |||||
Interest expense, net |
(5,071 | ) | (6,282 | ) | (7,418 | ) | (10,516 | ) | |||||
Other income (expense), net |
(390 | ) | (1,103 | ) | 736 | (213 | ) | ||||||
Loss from equity method investments |
(76 | ) | | | | ||||||||
Gain from sale of equity method investment |
4,705 | | | | |||||||||
Gain (loss) from sale of subsidiary |
| 15,498 | | (1,383 | ) | ||||||||
| | | | | | | | | | | | | | |
Loss before income taxes |
(2,030 | ) | (11,715 | ) | (18,237 | ) | (31,222 | ) | |||||
Income tax expense |
(1,805 | ) | (293 | ) | (558 | ) | (1,059 | ) | |||||
| | | | | | | | | | | | | | |
Net loss |
(3,835 | ) | (12,008 | ) | (18,795 | ) | (32,281 | ) | |||||
Income (loss) of noncontrolling interest |
36 | (65 | ) | 41 | 37 | ||||||||
| | | | | | | | | | | | | | |
Net loss attributable to Clean Energy Fuels Corp. |
$ | (3,871 | ) | $ | (11,943 | ) | $ | (18,836 | ) | $ | (32,318 | ) | |
| | | | | | | | | | | | | | |
| | | | | | | | | | | | | | |
| | | | | | | | | | | | | | |
Basic loss per share |
$ | (0.04 | ) | $ | (0.13 | ) | $ | (0.20 | ) | $ | (0.34 | ) | |
| | | | | | | | | | | | | | |
| | | | | | | | | | | | | | |
| | | | | | | | | | | | | | |
Fully diluted loss per share |
$ | (0.04 | ) | $ | (0.13 | ) | $ | (0.20 | ) | $ | (0.34 | ) | |
| | | | | | | | | | | | | | |
| | | | | | | | | | | | | | |
| | | | | | | | | | | | | | |
57
|
|
For the Quarter Ended | ||||||||||||
|---|---|---|---|---|---|---|---|---|---|---|---|---|---|
|
|
March 31, 2014 |
June 30, 2014 |
September 30, 2014 |
December 31, 2014 |
|||||||||
Revenue: |
|||||||||||||
Product revenues |
$ | 85,789 | $ | 86,473 | $ | 90,448 | $ | 117,489 | |||||
Service revenues |
9,486 | 11,660 | 12,972 | 14,623 | |||||||||
| | | | | | | | | | | | | | |
Total revenues |
95,275 | 98,133 | 103,420 | 132,112 | |||||||||
Operating expenses: |
|||||||||||||
Cost of sales (exclusive of depreciation and amortization shown separately below): |
|||||||||||||
Product cost of sales |
67,867 | 69,175 | 79,021 | 75,399 | |||||||||
Service cost of sales |
3,764 | 4,080 | 4,953 | 4,528 | |||||||||
Derivative (gains) losses: |
|||||||||||||
Series I warrant valuation |
(4,455 | ) | 2,286 | (3,255 | ) | (324 | ) | ||||||
Selling, general and administrative |
33,490 | 34,400 | 28,240 | 30,305 | |||||||||
Depreciation and amortization |
11,515 | 11,608 | 12,325 | 13,610 | |||||||||
Impairment of long-lived intangible definite lived assets |
| | | 4,772 | |||||||||
| | | | | | | | | | | | | | |
Total operating expenses |
112,181 | 121,549 | 121,284 | 128,290 | |||||||||
| | | | | | | | | | | | | | |
Operating income (loss) |
(16,906 | ) | (23,416 | ) | (17,864 | ) | 3,822 | ||||||
Interest expense, net |
(9,510 | ) | (10,130 | ) | (10,676 | ) | (14,041 | ) | |||||
Other income (expense), net |
(1,286 | ) | 1,121 | (880 | ) | (1,526 | ) | ||||||
Loss from equity method investments |
| | | (490 | ) | ||||||||
Gain from sale of equity method investment |
| | | | |||||||||
Gain (loss) from sale of subsidiary |
| | | 11,998 | |||||||||
| | | | | | | | | | | | | | |
Loss before income taxes |
(27,702 | ) | (32,425 | ) | (29,420 | ) | (237 | ) | |||||
Income tax (expense) benefit |
(962 | ) | (147 | ) | (811 | ) | 845 | ||||||
| | | | | | | | | | | | | | |
Net income (loss) |
(28,664 | ) | (32,572 | ) | (30,231 | ) | 608 | ||||||
Loss of noncontrolling interest |
(71 | ) | (266 | ) | (138 | ) | (725 | ) | |||||
| | | | | | | | | | | | | | |
Net income (loss) attributable to Clean Energy Fuels Corp. |
$ | (28,593 | ) | $ | (32,306 | ) | $ | (30,093 | ) | $ | 1,333 | ||
| | | | | | | | | | | | | | |
| | | | | | | | | | | | | | |
| | | | | | | | | | | | | | |
Basic income (loss) per share |
$ | (0.30 | ) | $ | (0.34 | ) | $ | (0.32 | ) | $ | 0.01 | ||
| | | | | | | | | | | | | | |
| | | | | | | | | | | | | | |
| | | | | | | | | | | | | | |
Fully diluted income (loss) per share |
$ | (0.30 | ) | $ | (0.34 | ) | $ | (0.32 | ) | $ | 0.01 | ||
| | | | | | | | | | | | | | |
| | | | | | | | | | | | | | |
| | | | | | | | | | | | | | |
58
59
Report of Independent Registered Public Accounting Firm
The
Board of Directors and Stockholders
Clean Energy Fuels Corp.:
We have audited the accompanying consolidated balance sheets of Clean Energy Fuels Corp. and subsidiaries (the Company) as of December 31, 2013 and 2014, and the related consolidated statements of operations, comprehensive income (loss), stockholders' equity, and cash flows for each of the years in the three-year period ended December 31, 2014. In connection with our audits of the consolidated financial statements, we have also audited the related financial statement schedule. We also have audited the Company's internal control over financial reporting as of December 31, 2014, based on criteria established in Internal ControlIntegrated Framework (1992) issued by the Committee of Sponsoring Organizations of the Treadway Commission (COSO). The Company's management is responsible for these consolidated financial statements and financial statement schedule, for maintaining effective internal control over financial reporting, and for its assessment of the effectiveness of internal control over financial reporting, included in the accompanying Management's Report on Internal Control Over Financial Reporting. Our responsibility is to express an opinion on these consolidated financial statements and financial statement schedule and an opinion on the Company's internal control over financial reporting based on our audits.
We conducted our audits in accordance with the standards of the Public Company Accounting Oversight Board (United States). Those standards require that we plan and perform the audits to obtain reasonable assurance about whether the financial statements are free of material misstatement and whether effective internal control over financial reporting was maintained in all material respects. Our audits of the consolidated financial statements included examining, on a test basis, evidence supporting the amounts and disclosures in the financial statements, assessing the accounting principles used and significant estimates made by management, and evaluating the overall financial statement presentation. Our audit of internal control over financial reporting included obtaining an understanding of internal control over financial reporting, assessing the risk that a material weakness exists, and testing and evaluating the design and operating effectiveness of internal control based on the assessed risk. Our audits also included performing such other procedures as we considered necessary in the circumstances. We believe that our audits provide a reasonable basis for our opinions.
A company's internal control over financial reporting is a process designed to provide reasonable assurance regarding the reliability of financial reporting and the preparation of financial statements for external purposes in accordance with generally accepted accounting principles. A company's internal control over financial reporting includes those policies and procedures that (1) pertain to the maintenance of records that, in reasonable detail, accurately and fairly reflect the transactions and dispositions of the assets of the company; (2) provide reasonable assurance that transactions are recorded as necessary to permit preparation of financial statements in accordance with generally accepted accounting principles, and that receipts and expenditures of the company are being made only in accordance with authorizations of management and directors of the company; and (3) provide reasonable assurance regarding prevention or timely detection of unauthorized acquisition, use, or disposition of the company's assets that could have a material effect on the financial statements.
Because of its inherent limitations, internal control over financial reporting may not prevent or detect misstatements. Also, projections of any evaluation of effectiveness to future periods are subject to the risk that controls may become inadequate because of changes in conditions, or that the degree of compliance with the policies or procedures may deteriorate.
In our opinion, the consolidated financial statements referred to above present fairly, in all material respects, the financial position of Clean Energy Fuels Corp. and subsidiaries as of December 31, 2013 and 2014, and the results of its operations and its cash flows for each of the years in the three-year period ended December 31, 2014, in conformity with U.S. generally accepted
60
accounting principles. Also in our opinion, the related financial statement schedule, when considered in relation to the basic consolidated financial statements taken as a whole, presents fairly, in all material aspects, the information set forth therein. Also, in our opinion, Clean Energy Fuels Corp. and subsidiaries maintained, in all material respects, effective internal control over financial reporting as of December 31, 2014, based on criteria established in Internal ControlIntegrated Framework (1992) issued by the Committee of Sponsoring Organizations of the Treadway Commission (COSO).
/s/ KPMG LLP
Irvine,
California
February 26, 2015
61
CLEAN ENERGY FUELS CORP. AND SUBSIDIARIES
CONSOLIDATED BALANCE SHEETS
(In thousands, except share data)
|
|
December 31, 2013 |
December 31, 2014 |
|||||
|---|---|---|---|---|---|---|---|
Assets |
|||||||
Current assets: |
|||||||
Cash and cash equivalents |
$ | 240,033 | $ | 92,381 | |||
Restricted cash |
8,403 | 6,012 | |||||
Short-term investments |
138,240 | 122,546 | |||||
Accounts receivable, net of allowance for doubtful accounts of $832 and $752 as of December 31, 2013 and December 31, 2014, respectively |
53,473 | 81,970 | |||||
Other receivables |
26,285 | 56,223 | |||||
Inventory |
33,822 | 34,696 | |||||
Prepaid expenses and other current assets |
20,840 | 19,811 | |||||
| | | | | | | | |
Total current assets |
521,096 | 413,639 | |||||
Land, property and equipment, net |
487,854 | 514,269 | |||||
Notes receivable and other long-term assets, net |
73,697 | 71,904 | |||||
Investments in other entities |
| 6,510 | |||||
Goodwill |
88,548 | 98,726 | |||||
Intangible assets, net |
79,770 | 55,361 | |||||
| | | | | | | | |
Total assets |
$ | 1,250,965 | $ | 1,160,409 | |||
| | | | | | | | |
| | | | | | | | |
| | | | | | | | |
Liabilities and Stockholders' Equity |
|||||||
Current liabilities: |
|||||||
Current portion of long-term debt and capital lease obligations |
$ | 23,401 | $ | 4,846 | |||
Accounts payable |
33,541 | 43,922 | |||||
Accrued liabilities |
46,745 | 56,760 | |||||
Deferred revenue |
16,419 | 14,683 | |||||
| | | | | | | | |
Total current liabilities |
120,106 | 120,211 | |||||
Long-term debt and capital lease obligations, less current portion |
532,017 | 500,824 | |||||
Long-term debt, related party |
65,000 | 65,000 | |||||
Other long-term liabilities |
15,304 | 9,339 | |||||
| | | | | | | | |
Total liabilities |
732,427 | 695,374 | |||||
Commitments and contingencies |
|||||||
Stockholders' equity: |
|||||||
Preferred stock, $0.0001 par value. Authorized 1,000,000 shares; issued and outstanding no shares |
| | |||||
Common stock, $0.0001 par value. Authorized 149,000,000 shares , issued and outstanding 89,364,397 shares at December 31, 2013; authorized 224,000,000 shares, issued and outstanding 90,203,344 shares at December 31, 2014 |
9 | 9 | |||||
Additional paid-in capital |
883,045 | 898,106 | |||||
Accumulated deficit |
(367,782 | ) | (457,441 | ) | |||
Accumulated other comprehensive income (loss) |
(700 | ) | (3,248 | ) | |||
| | | | | | | | |
Total Clean Energy Fuels Corp. stockholders' equity |
514,572 | 437,426 | |||||
Noncontrolling interest in subsidiary |
3,966 | 27,609 | |||||
| | | | | | | | |
Total stockholders' equity |
518,538 | 465,035 | |||||
| | | | | | | | |
Total liabilities and stockholders' equity |
$ | 1,250,965 | $ | 1,160,409 | |||
| | | | | | | | |
| | | | | | | | |
| | | | | | | | |
See accompanying notes to consolidated financial statements.
62
CLEAN ENERGY FUELS CORP. AND SUBSIDIARIES
CONSOLIDATED STATEMENTS OF OPERATIONS
(In thousands, except share and per share data)
|
|
Years Ended December 31, | |||||||||
|---|---|---|---|---|---|---|---|---|---|---|
|
|
2012 | 2013 | 2014 | |||||||
Revenue: |
||||||||||
Product revenues |
$ | 293,777 | $ | 310,813 | $ | 380,199 | ||||
Service revenues |
40,231 | 41,662 | 48,741 | |||||||
| | | | | | | | | | | |
Total revenue |
334,008 | 352,475 | 428,940 | |||||||
Operating expenses: |
||||||||||
Cost of sales (exclusive of depreciation and amortization shown separately below): |
||||||||||
Product cost of sales |
236,471 | 213,593 | 291,462 | |||||||
Service cost of sales |
17,213 | 11,169 | 17,325 | |||||||
Derivative gains: |
||||||||||
Series I warrant valuation |
(3,391 | ) | (938 | ) | (5,748 | ) | ||||
Selling, general and administrative |
117,976 | 138,024 | 126,435 | |||||||
Depreciation and amortization |
36,261 | 42,318 | 49,058 | |||||||
Impairment of long-lived asset |
| | 4,772 | |||||||
| | | | | | | | | | | |
Total operating expenses |
404,530 | 404,166 | 483,304 | |||||||
| | | | | | | | | | | |
Operating loss |
(70,522 | ) | (51,691 | ) | (54,364 | ) | ||||
Interest expense, net |
(16,069 | ) | (29,287 | ) | (44,357 | ) | ||||
Other income (expense), net |
1,236 | (970 | ) | (2,571 | ) | |||||
Impairment of cost method investment |
(14,544 | ) | | | ||||||
Income (loss) from equity method investments |
331 | (76 | ) | (490 | ) | |||||
Gain from sale of equity method investment |
| 4,705 | | |||||||
Gain from sale of subsidiary |
| 14,115 | 11,998 | |||||||
| | | | | | | | | | | |
Loss before income taxes |
(99,568 | ) | (63,204 | ) | (89,784 | ) | ||||
Income tax (expense) benefit |
(1,294 | ) | (3,715 | ) | (1,075 | ) | ||||
| | | | | | | | | | | |
Net loss |
(100,862 | ) | (66,919 | ) | (90,859 | ) | ||||
Loss (income) of noncontrolling interest |
(393 | ) | (49 | ) | 1,200 | |||||
| | | | | | | | | | | |
Net loss attributable to Clean Energy Fuels Corp. |
$ | (101,255 | ) | $ | (66,968 | ) | $ | (89,659 | ) | |
| | | | | | | | | | | |
| | | | | | | | | | | |
| | | | | | | | | | | |
Loss per share: |
||||||||||
Basic and diluted |
$ | (1.16 | ) | $ | (0.71 | ) | $ | (0.96 | ) | |
| | | | | | | | | | | |
| | | | | | | | | | | |
| | | | | | | | | | | |
Weighted average common shares outstanding: |
||||||||||
Basic and diluted |
87,455,073 | 93,958,758 | 93,678,432 | |||||||
| | | | | | | | | | | |
| | | | | | | | | | | |
| | | | | | | | | | | |
See accompanying notes to consolidated financial statements.
63
CLEAN ENERGY FUELS CORP. AND SUBSIDIARIES
CONSOLIDATED STATEMENTS OF COMPREHENSIVE INCOME (LOSS)
(In thousands)
|
|
Year Ended December 31, 2012 | Year Ended December 31, 2013 | Year Ended December 31, 2014 | |||||||||||||||||||||||||
|---|---|---|---|---|---|---|---|---|---|---|---|---|---|---|---|---|---|---|---|---|---|---|---|---|---|---|---|---|
|
|
Clean Energy Fuels Corp |
Noncontrolling Interest |
Total | Clean Energy Fuels Corp |
Noncontrolling Interest |
Total | Clean Energy Fuels Corp |
Noncontrolling Interest |
Total | |||||||||||||||||||
Net income (loss) |
$ | (101,255 | ) | $ | 393 | $ | (100,862 | ) | $ | (66,968 | ) | $ | 49 | $ | (66,919 | ) | $ | (89,659 | ) | $ | (1,200 | ) | $ | (90,859 | ) | |||
Other comprehensive income, net of tax: |
||||||||||||||||||||||||||||
Foreign currency translation adjustments |
4,030 | | 4,030 | (1,680 | ) | | (1,680 | ) | (7,958 | ) | | (7,958 | ) | |||||||||||||||
Foreign currency adjustments on intra-entity long-term investments |
1,218 | | 1,218 | (4,834 | ) | | (4,834 | ) | 4,866 | | 4,866 | |||||||||||||||||
Unrealized gains (losses) on available-for sale securities |
(32 | ) | | (32 | ) | (445 | ) | | (445 | ) | 544 | | 544 | |||||||||||||||
Unrecognized gains on derivatives |
2,151 | | 2,151 | 108 | | 108 | | | | |||||||||||||||||||
| | | | | | | | | | | | | | | | | | | | | | | | | | | | | |
Total other comprehensive income (loss), net of tax |
7,367 | | 7,367 | (6,851 | ) | | (6,851 | ) | (2,548 | ) | | (2,548 | ) | |||||||||||||||
| | | | | | | | | | | | | | | | | | | | | | | | | | | | | |
Comprehensive income (loss) |
$ | (93,888 | ) | $ | 393 | $ | (93,495 | ) | $ | (73,819 | ) | $ | 49 | $ | (73,770 | ) | $ | (92,207 | ) | $ | (1,200 | ) | $ | (93,407 | ) | |||
| | | | | | | | | | | | | | | | | | | | | | | | | | | | | |
| | | | | | | | | | | | | | | | | | | | | | | | | | | | | |
| | | | | | | | | | | | | | | | | | | | | | | | | | | | | |
See accompanying notes to consolidated financial statements.
64
CLEAN ENERGY FUELS CORP. AND SUBSIDIARIES
CONSOLIDATED STATEMENTS OF STOCKHOLDERS' EQUITY
(In thousands, except share data)
|
|
Common stock |
|
Retained Earnings (Accumulated Deficit) |
Accumulated Other Comprehensive Income (Loss) |
|
|
||||||||||||||||
|---|---|---|---|---|---|---|---|---|---|---|---|---|---|---|---|---|---|---|---|---|---|---|
|
|
Additional Paid-In Capital |
Noncontrolling Interest in Subsidiary |
Total Stockholders' Equity |
|||||||||||||||||||
|
|
Shares | Amount | ||||||||||||||||||||
Balance, December 31, 2011 |
85,433,258 | 9 | 741,650 | (199,559 | ) | (1,216 | ) | 3,524 | 544,408 | |||||||||||||
Issuance of common stock upon exercise of options |
1,568,480 | | 8,969 | | | | 8,969 | |||||||||||||||
Issuance of common stock, net of offering costs |
632,740 | | 8,503 | | | | 8,503 | |||||||||||||||
Issuance of warrants in connection with the Credit Agreement |
| | 56,158 | | | | 56,158 | |||||||||||||||
Stock-based compensation |
| | 22,087 | | | | 22,087 | |||||||||||||||
Net (loss) income |
| | | (101,255 | ) | | 393 | (100,862 | ) | |||||||||||||
Accumulated other comprehensive income |
| | | | 7,367 | | 7,367 | |||||||||||||||
| | | | | | | | | | | | | | | | | | | | | | | |
Balance, December 31, 2012 |
87,634,478 | 9 | 837,367 | (300,814 | ) | 6,151 | 3,917 | 546,630 | ||||||||||||||
Issuance of common stock upon exercise of options |
119,349 | | 677 | | | | 677 | |||||||||||||||
Issuance of common stock, net of offering costs |
1,610,570 | | 21,993 | | | | 21,993 | |||||||||||||||
Stock-based compensation |
| | 23,008 | | | | 23,008 | |||||||||||||||
Net (loss) income |
| | | (66,968 | ) | | 49 | (66,919 | ) | |||||||||||||
Accumulated other comprehensive loss |
| | | | (6,851 | ) | | (6,851 | ) | |||||||||||||
| | | | | | | | | | | | | | | | | | | | | | | |
Balance, December 31, 2013 |
89,364,397 | 9 | 883,045 | (367,782 | ) | (700 | ) | 3,966 | 518,538 | |||||||||||||
Issuance of common stock upon exercise of options |
483,863 | | 1,771 | | | | 1,771 | |||||||||||||||
Issuance of common stock in connection with ESPP |
35,745 | | 529 | | | | 529 | |||||||||||||||
Issuance of common stock, net of offering costs |
319,339 | | 3,750 | | | | 3,750 | |||||||||||||||
Exercise of additional membership interest in subsidiary |
| | 2,363 | | | | 2,363 | |||||||||||||||
Stock-based compensation |
| | 11,514 | | | | 11,514 | |||||||||||||||
Foreign currency adjustments on intra-entity long-term investments converted to equity |
| | (4,866 | ) | | | | (4,866 | ) | |||||||||||||
Acquisition of non-controlling interest in subsidiary |
| | | | | 28,075 | 28,075 | |||||||||||||||
Sale of non-controlling interest in subsidiary |
| | | | | (3,232 | ) | (3,232 | ) | |||||||||||||
Net (loss) income |
| | | (89,659 | ) | | (1,200 | ) | (90,859 | ) | ||||||||||||
Accumulated other comprehensive loss |
| | | | (2,548 | ) | | (2,548 | ) | |||||||||||||
| | | | | | | | | | | | | | | | | | | | | | | |
Balance, December 31, 2014 |
90,203,344 | $ | 9 | $ | 898,106 | $ | (457,441 | ) | $ | (3,248 | ) | 27,609 | $ | 465,035 | ||||||||
| | | | | | | | | | | | | | | | | | | | | | | |
| | | | | | | | | | | | | | | | | | | | | | | |
| | | | | | | | | | | | | | | | | | | | | | | |
See accompanying notes to consolidated financial statements.
65
CLEAN ENERGY FUELS CORP. AND SUBSIDIARIES
CONSOLIDATED STATEMENTS OF CASH FLOWS
(In thousands)
|
|
Years Ended December 31, | |||||||||
|---|---|---|---|---|---|---|---|---|---|---|
|
|
2012 | 2013 | 2014 | |||||||
Cash flows from operating activities: |
||||||||||
Net loss |
$ | (100,862 | ) | $ | (66,919 | ) | $ | (90,859 | ) | |
Adjustments to reconcile net loss to net cash used in operating activities: |
||||||||||
Depreciation and amortization |
36,261 | 42,318 | 49,058 | |||||||
Impairment of cost method investment |
14,544 | | | |||||||
Provision for doubtful accounts and notes |
1,358 | 1,962 | 1,277 | |||||||
Derivative gain |
(3,391 | ) | (938 | ) | (5,748 | ) | ||||
Stock-based compensation expense |
22,087 | 23,008 | 11,514 | |||||||
Amortization of debt issuance cost |
551 | 1,662 | 4,194 | |||||||
Accretion of notes payable |
2,016 | 1,140 | 412 | |||||||
Gain on sale of equity method investment |
| (4,705 | ) | | ||||||
Dividend received on equity method investment |
| 1,091 | | |||||||
Long-lived intangible impairment |
| | 4,772 | |||||||
Gain on sale of subsidiary |
| (14,115 | ) | (11,998 | ) | |||||
Gain on contingent consideration for acquisitions |
(4,112 | ) | (1,132 | ) | (208 | ) | ||||
Changes in operating assets and liabilities, net of assets and liabilities acquired: |
||||||||||
Accounts and other receivables |
1,832 | (441 | ) | (55,573 | ) | |||||
Inventory |
(1,879 | ) | (637 | ) | (979 | ) | ||||
Margin deposits on futures contracts |
3,000 | | | |||||||
Prepaid expenses and other assets |
4,201 | 579 | 1,361 | |||||||
Accounts payable |
(328 | ) | (6,962 | ) | 9,126 | |||||
Accrued expenses and other |
4,966 | 19,395 | 7,646 | |||||||
| | | | | | | | | | | |
Net cash used in operating activities |
(19,756 | ) | (4,694 | ) | (76,005 | ) | ||||
Cash flows from investing activities: |
||||||||||
Purchases of short-term investments |
(55,062 | ) | (170,935 | ) | (157,629 | ) | ||||
Maturities and sales of short-term investments |
49,504 | 93,289 | 171,902 | |||||||
Purchases of property and equipment |
(192,894 | ) | (86,730 | ) | (86,235 | ) | ||||
Loans made to customers |
(10,521 | ) | (3,950 | ) | (9,140 | ) | ||||
Payments on and proceeds from sales of loans receivable |
8,251 | 4,153 | 6,580 | |||||||
Restricted cash |
37,943 | 13,250 | (3,567 | ) | ||||||
Cash received with sale of subsidiary, net of cash transferred |
| (1,178 | ) | 39,760 | ||||||
Deposits on equipment |
| | (2,393 | ) | ||||||
Investments in other entities |
(1,437 | ) | | (6,634 | ) | |||||
Proceeds from sale of equity method investment |
| 6,119 | | |||||||
Acquisitions, net of cash acquired |
269 | (9,000 | ) | 467 | ||||||
| | | | | | | | | | | |
Net cash used in investing activities |
(163,947 | ) | (154,982 | ) | (46,889 | ) | ||||
Cash flows from financing activities: |
||||||||||
Proceeds from issuance of common stock and exercise of stock options |
8,969 | 677 | 2,300 | |||||||
Proceeds from debt instruments |
50,612 | 300,559 | 12,778 | |||||||
Proceeds from debt, related party |
| 15,000 | | |||||||
Proceeds from revolving line of credit |
39,164 | 31,527 | 34,607 | |||||||
Proceeds from exercise of additional membership interest in subsidiary |
| | 6,992 | |||||||
Repayment of borrowings under revolving line of credit |
(34,735 | ) | (37,767 | ) | (40,354 | ) | ||||
Repayment of capital lease obligations and debt instruments |
(10,040 | ) | (10,147 | ) | (41,036 | ) | ||||
Contingent consideration paid relating to business acquisitions |
(350 | ) | | (176 | ) | |||||
Payment for debt issuance costs |
| (9,130 | ) | (896 | ) | |||||
| | | | | | | | | | | |
Net cash provided (used) by financing activities |
53,620 | 290,719 | (25,785 | ) | ||||||
Effect of exchange rates on cash and cash equivalents |
480 | 468 | 1,027 | |||||||
| | | | | | | | | | | |
Net increase (decrease) in cash and cash equivalents |
(129,603 | ) | 131,511 | (147,652 | ) | |||||
Cash and cash equivalents, beginning of year |
238,125 | 108,522 | 240,033 | |||||||
| | | | | | | | | | | |
Cash and cash equivalents, end of year |
$ | 108,522 | $ | 240,033 | $ | 92,381 | ||||
| | | | | | | | | | | |
| | | | | | | | | | | |
| | | | | | | | | | | |
Supplemental disclosure of cash flow information: |
||||||||||
Income taxes paid |
$ | 1,160 | $ | 2,228 | $ | 943 | ||||
| | | | | | | | | | | |
| | | | | | | | | | | |
| | | | | | | | | | | |
Interest paid, net of $6,304, $2,517, and $3,160 capitalized, respectively |
$ | 13,994 | $ | 22,110 | $ | 39,224 | ||||
| | | | | | | | | | | |
| | | | | | | | | | | |
| | | | | | | | | | | |
See accompanying notes to consolidated financial statements.
66
CLEAN ENERGY FUELS CORP. AND SUBSIDIARIES
NOTES TO CONSOLIDATED FINANCIAL STATEMENTS
(In thousands, except share and per share data)
(1) Summary of Significant Accounting Policies
The Company
Clean Energy Fuels Corp., together with its majority and wholly owned subsidiaries (hereinafter collectively referred to as the "Company," unless the context of the use of the term indicates or requires otherwise) is engaged in the business of selling natural gas fueling solutions to its customers, primarily in the United States and Canada.
The Company has a broad customer base in a variety of markets, including trucking, airports, taxis, refuse, ready mix, and public transit. The Company owns, operates, maintains and/or supplies over 540 natural gas fueling stations within the United States and Canada. The Company generates revenue through selling compressed natural gas ("CNG") and liquefied natural gas ("LNG"), providing operation and maintenance ("O&M") services to customers, building and selling natural gas fueling stations to customers, manufacturing and servicing non-lubricated natural gas fueling compressors and other equipment for CNG and LNG fueling stations, offering assessment, design and modification solutions to provide operators with code-compliant service and maintenance facilities for natural gas vehicle fleets, processing and selling renewable natural gas ("RNG"), financing customers' vehicle purchases and selling tradable credits the Company generates by selling natural gas and RNG as a vehicle fuel, including credits ("LCFS Credits") under the California low carbon fuel standard and Renewable Identification Numbers ("RIN Credits") under the federal Renewable Fuel Standard Phase 2. In addition, through June 28, 2013, the Company provided natural gas vehicle conversions and design and engineering services for natural gas engine systems (see note 2).
Basis of Presentation
The consolidated financial statements include the accounts of the Company and its subsidiaries, and, in the opinion of management, reflect all adjustments, which include only normal recurring adjustments, necessary to state fairly the Company's financial position, results of operations and cash flows in accordance with U.S. generally accepted accounting principles ("US GAAP"). All intercompany accounts and transactions have been eliminated in consolidation.
Use of Estimates
The preparation of consolidated financial statements in conformity with US GAAP requires management to make estimates and assumptions that affect the reported amounts of assets and liabilities and the disclosure of contingent assets and liabilities at the date of the consolidated financial statements and revenues and expenses recorded during the reporting periods. Actual results could differ from those estimates. Significant estimates made in preparing the consolidated financial statements include (but are not limited to) those related to revenue recognition, warranty reserves, goodwill and long-lived intangible asset valuations and impairment assessments, income tax valuations, and stock-based compensation expenses.
Cash and Cash Equivalents
The Company considers all highly liquid investments with maturities of three months or less on the date of acquisition to be cash equivalents.
67
CLEAN ENERGY FUELS CORP. AND SUBSIDIARIES
NOTES TO CONSOLIDATED FINANCIAL STATEMENTS (Continued)
(In thousands, except share and per share data)
(1) Summary of Significant Accounting Policies (Continued)
Fair Value of Financial Instruments
The carrying values of the Company's financial instruments, including cash and cash equivalents, short-term investments, accounts and other receivables, notes receivable, accounts payable, accrued expenses and other current liabilities, capital lease obligations and notes payable approximate fair value.
Inventories
Inventory consists of work in process and finished goods and is stated at the lower of cost (first-in, first-out) or market. The Company writes down the carrying value of its inventory to net realizable value for estimated obsolescence or unmarketable inventory in an amount equal to the difference between the cost of inventory and its estimated realizable value based upon assumptions about future demand and market conditions, among other factors.
Inventories consisted of the following as of December 31, 2013 and 2014:
|
|
2013 | 2014 | |||||
|---|---|---|---|---|---|---|---|
Raw materials and spare parts |
$ | 30,521 | $ | 31,389 | |||
Work in process |
3,011 | 3,292 | |||||
Finished goods |
290 | 15 | |||||
| | | | | | | | |
Total |
$ | 33,822 | $ | 34,696 | |||
| | | | | | | | |
| | | | | | | | |
| | | | | | | | |
Property and Equipment
Property and equipment are recorded at cost. Depreciation and amortization are recognized over the estimated useful lives of the assets using the straight-line method. The estimated useful lives of depreciable assets are 20 years for LNG liquefaction plant assets, 10 years for station equipment and LNG trailers, and three to seven years for all other depreciable assets. Leasehold improvements are amortized over the shorter of their estimated useful lives or related lease terms. Periodically, the Company receives grant funding to assist in the financing of natural gas fueling station construction. The Company records the grant proceeds as a reduction of the cost of the respective asset. Total grant proceeds received were approximately $5,908, $3,114, and $959 for the years ended December 31, 2012, 2013, and 2014 respectively.
Long-Lived Assets
The Company reviews long-lived assets for impairment whenever events or changes in circumstances indicate that the carrying value of an asset may not be recoverable. Recoverability of long-lived assets to be held and used is measured by a comparison of the carrying amount of an asset to future net undiscounted cash flows expected to be generated by the asset or asset group. If such assets are considered to be impaired, the impairment to be recognized is measured by the amount by which the carrying amount of the assets exceeds the fair value of the assets.
68
CLEAN ENERGY FUELS CORP. AND SUBSIDIARIES
NOTES TO CONSOLIDATED FINANCIAL STATEMENTS (Continued)
(In thousands, except share and per share data)
(1) Summary of Significant Accounting Policies (Continued)
Goodwill and Intangible Assets
Goodwill represents the excess of costs incurred over the fair value of the net assets of acquired businesses. Goodwill and intangible assets acquired in a business combination and determined to have an indefinite useful life are not amortized. The Company assesses its goodwill and indefinite lived intangible assets for impairment annually on October 1, or more frequently if a triggering event occurs between impairment testing dates. The Company's impairment assessment begins with a qualitative assessment to determine whether it is more likely than not that the fair value of a reporting unit is less than its carrying value. The qualitative assessment includes assessing the potential impact on a reporting unit's fair value of certain events and circumstances, including the Company's market capitalization value, macroeconomic conditions, industry and market considerations, cost factors, and other relevant entity-specific events. If it is determined, based upon the qualitative assessment, that it is more likely than not that the reporting unit's fair value is less than its carrying amount, then a two-step quantitative impairment test is performed. A qualitative assessment is an option available on an individual reporting unit basis and is an unconditional alternative to Step 1 of the goodwill impairment test. A reporting entity can choose to perform either Step 1 or a qualitative assessment in subsequent reporting periods. If the Company does conduct a Step 1 test, the Company looks at its projected future cash flows and its market capitalization for its respective operations. In these instances, to the extent the Company's projected future cash flows do not materialize as planned or its market capitalization decreases, the Company could be forced to take an impairment charge in future periods.
The Company tests tangible and intangible long -lived assets with definite useful lives for impairment whenever circumstances or events may affect the recoverability of the long -lived assets. The evaluation is primarily dependent on the estimated future cash flows of the assets and the fair value of these items, as determined by management based on a number of estimates, including future cash flow projections, discount rates and terminal values. In determining these estimates, management considers internally generated information and information obtained from discussions with market participants. The determination of fair value requires significant judgment by both management and outside experts engaged to assist in this process. There were no impairment charges for goodwill or indefinite-lived intangible assets resulting from the October 1, 2012, 2013 or 2014 impairment testing. The Company reduced its goodwill balance by $774 and $7,205 when it sold BAF and its interest in DCE and its subsidiary DCEMB on June 28, 2013 and December 29, 2014, respectively, and added $16,555 and $21,070 to its goodwill balance when it acquired MGES and NG Advantage on May 6, 2013 and October 14, 2014, respectively (all as defined and described in note 2). The goodwill balances on the consolidated balance sheets include foreign currency translation gains (losses) of $(3,098) and $(3,687) as of December 31, 2013 and 2014, respectively.
Intangible assets with finite useful lives are amortized over their respective estimated useful lives using the straight-line method. The estimated useful lives of intangible assets with finite useful lives are two to 20 years for technology, one to 16 years for lease agreements, one to eight years for customer relationships, one to 10 years for acquired contracts, two to 20 years for trademarks and trade names, and three years for non-compete agreements. The intangible assets with finite useful lives are reviewed for impairment whenever events or changes in circumstances indicate that the carrying value of the asset may not be recoverable. In connection with the acquisition of the controlling interest in NG Advantage, the Company allocated approximately $5,600 of the purchase price to the identifiable
69
CLEAN ENERGY FUELS CORP. AND SUBSIDIARIES
NOTES TO CONSOLIDATED FINANCIAL STATEMENTS (Continued)
(In thousands, except share and per share data)
(1) Summary of Significant Accounting Policies (Continued)
intangible assets related to customer relationships and trade names that were acquired with the acquisition. In the fourth quarter of 2014, the Company determined that a long-lived asset related to a contract acquired in its acquisition of the assets of IMW Industries, Ltd. ("IMW") was impaired. Accordingly, the Company recorded an impairment charge of $4,772 related to this intangible asset.
The Company's intangible assets as of December 31, 2013 and 2014 were as follows:
|
|
2013 | 2014 | |||||
|---|---|---|---|---|---|---|---|
Technology |
$ | 54,400 | $ | 54,400 | |||
Lease agreements |
21,045 | | |||||
Customer relationships |
12,791 | 16,430 | |||||
Acquired contracts |
13,121 | 3,694 | |||||
Trademark and trade names |
6,700 | 8,200 | |||||
Non-compete agreements |
2,126 | 2,060 | |||||
| | | | | | | | |
Total intangible assets |
110,183 | 84,784 | |||||
Less accumulated amortization |
(30,003 | ) | (24,384 | ) | |||
Foreign currency rate change |
(410 | ) | (5,039 | ) | |||
| | | | | | | | |
Net intangible assets |
$ | 79,770 | $ | 55,361 | |||
| | | | | | | | |
| | | | | | | | |
| | | | | | | | |
Included above is a trademark of indefinite useful life with a carrying value of $1,200 as of December 31, 2013 and 2014.
Amortization expense for intangible assets was $10,875, $9,016, and $7,024 for the years ended December 31, 2012, 2013 and 2014, respectively. Estimated amortization expense for the five years and thereafter succeeding the year ended December 31, 2014 is approximately $5,130, $5,130, $4,916, $4,366, $3,465 and $32,354 respectively.
Warranty Liability
The Company records warranty liabilities at the time of sale for the estimated costs that may be incurred under its standard warranty. Changes in the warranty liability are presented in the following table:
|
|
December 31, 2013 |
December 31, 2014 |
|||||
|---|---|---|---|---|---|---|---|
Warranty liability at beginning of year |
$ | 2,665 | $ | 2,545 | |||
Costs accrued for new warranty contracts and changes in estimates for pre-existing warranties |
3,551 | 3,746 | |||||
Service obligations honored |
(3,089 | ) | (3,989 | ) | |||
Sale of subsidiary |
(582 | ) | | ||||
| | | | | | | | |
Warranty liability at end of year |
$ | 2,545 | $ | 2,302 | |||
| | | | | | | | |
| | | | | | | | |
| | | | | | | | |
70
CLEAN ENERGY FUELS CORP. AND SUBSIDIARIES
NOTES TO CONSOLIDATED FINANCIAL STATEMENTS (Continued)
(In thousands, except share and per share data)
(1) Summary of Significant Accounting Policies (Continued)
Asset Retirement Obligations
The Company recognizes the fair value of a liability for an asset retirement obligation in the period in which the liability is incurred or becomes reasonably estimable and if there is a legal obligation to restore or remediate the property at the end of the asset life or at the end of the lease term. The liability amounts are based upon future retirement cost estimates and incorporate many assumptions such as the costs to restore the property, future inflation rates, and the adjusted risk free rate of interest. When the liability is initially recorded, the Company capitalizes the cost by increasing the related property and equipment balance. Over time, the liability is increased and expense is recognized for the change in the present value of the obligation, and the initial capitalized cost is depreciated over the useful life of the asset.
The following table summarizes the activity of the asset retirement obligation, of which $1,322 and $1,603 is included in other long-term liabilities, with the remaining current portion included in accrued liabilities, as of December 31, 2013 and 2014, respectively:
|
|
2013 | 2014 | |||||
|---|---|---|---|---|---|---|---|
Beginning balance |
$ | 1,313 | $ | 1,461 | |||
Liabilities incurred |
89 | 118 | |||||
Liabilities settled |
(5 | ) | | ||||
Accretion expense |
64 | 59 | |||||
| | | | | | | | |
Ending balance |
$ | 1,461 | $ | 1,638 | |||
| | | | | | | | |
| | | | | | | | |
| | | | | | | | |
Revenue Recognition
The Company recognizes revenue on natural gas sales and O&M services in accordance with US GAAP, which requires that four basic criteria must be met before revenue can be recognized: (i) persuasive evidence of an arrangement exists; (ii) delivery has occurred and title and the risks and rewards of ownership have been transferred to the customer or services have been rendered; (iii) the price is fixed or determinable; and (iv) collectability is reasonably assured. Applying these factors, the Company typically recognizes revenue from the sale of natural gas fuel at the time the fuel is dispensed or, in the case of LNG sales agreements, delivered to the customers' storage facilities. The Company recognizes revenue from O&M agreements as the related services are provided.
In certain transactions with its customers, the Company agrees to provide multiple products or services, including construction of a station, providing O&M services to the station, and sale of fuel to the customer. The Company evaluates the separability of revenues based on Financial Accounting Standards Board ("FASB") authoritative guidance, which provides a framework for establishing whether or not a particular arrangement with a customer has one or more revenue elements, and allows the Company to use a combination of internal and external objective and reliable evidence to develop management's best estimate of the fair value of the contract elements. If the arrangement contains a lease, the Company uses the existing evidence of fair value to separate the lease from the other elements in the arrangement. The arrangement's consideration that is fixed or determinable is then allocated to each separate unit of accounting based on the estimated relative selling price of each deliverable, which is determined based on the historical data derived from the Company's stand-alone
71
CLEAN ENERGY FUELS CORP. AND SUBSIDIARIES
NOTES TO CONSOLIDATED FINANCIAL STATEMENTS (Continued)
(In thousands, except share and per share data)
(1) Summary of Significant Accounting Policies (Continued)
projects. The revenue allocated to the construction of the station is recognized using the completed-contract method. The revenue allocated to the O&M services is recognized ratably over the term of the arrangement and sale of fuel is recognized as the fuel is delivered.
The Company recognizes revenue related to its leasing activities in accordance with FASB authoritative guidance. The Company's existing station leases are sales-type leases, giving rise to profit at the delivery of the leased station. Unearned revenue is amortized into income over the life of the lease using the effective-interest method. For these arrangements, the Company recognizes gas sales and O&M service revenues as earned from the customer on a volume-delivered basis.
The Company typically recognizes revenue on fueling station construction projects where it sells the station to the customer using the completed-contract method because the projects are short-term and the results of operations reported on the completed-contract basis would not vary materially from those resulting from the use of the percentage-of-completion method. The construction contract is considered to be substantially completed at the earlier of customer acceptance of the fueling station or the time when the fuel dispensing activities begin. When applicable, multi-station construction contracts are segmented into phases as negotiated with customers. Gross margin related to each phase is recognized when it is substantially complete. IMW and Wyoming Northstar Incorporated, Southstar, LLC, and M&S Rental LLC (Wyoming Northstar Incorporated, Southstar, LLC, and M&S Rental LLC are collectively referred to as "Northstar") use the percentage-of-completion method of accounting to recognize revenue because their projects are small and they have been able to demonstrate that they can reasonably estimate costs to complete. In these circumstances, revenue is recognized based on costs incurred in relation to total estimated costs to be incurred for a project.
The Company generates LCFS Credits when it sells RNG and conventional natural gas for use as a vehicle fuel in California, and it generates RIN Credits when it sell RNG for use as a vehicle fuel. The Company can sell these credits to third parties who need the RIN Credits and LCFS Credits to comply with federal and state emission requirements. The Company recognizes revenue from the generation of these credits at the time the Company has an agreement in place to sell the credits at a fixed or determinable price.
Alternative Fuels Excise Tax Credit
From October 1, 2006 through December 31, 2011, the Company was eligible to receive a federal fuel tax credit ("VETC") of $0.50 per gasoline gallon equivalent of CNG and $0.50 per liquid gallon of LNG that it sold as vehicle fuel. Based on the service relationship with its customers, either the Company or its customers claimed the credit. The Company records its VETC credits as revenue in its consolidated statements of operations as the credits are fully refundable and do not need to offset income tax liabilities to be received. The American Taxpayer Relief Act, signed into law on January 2, 2013, reinstated VETC for calendar year 2013 and also made it retroactive to January 1, 2012. The Company did not record any VETC revenues in 2012, but VETC revenues recognized in 2013 were $45,439, which included $20,800 for CNG and LNG the Company sold in 2012 that was recognized in January 2013 when the legislation was signed into law. The Tax Increase Prevention Act, signed into law on December 19, 2014, reinstated VETC for calendar year 2014. VETC revenues recognized in December 2014 for the 2014 calendar year were $28,359.
72
CLEAN ENERGY FUELS CORP. AND SUBSIDIARIES
NOTES TO CONSOLIDATED FINANCIAL STATEMENTS (Continued)
(In thousands, except share and per share data)
(1) Summary of Significant Accounting Policies (Continued)
LNG Transportation Costs
The Company records the costs incurred to transport LNG to its customers in the line item cost of sales in the accompanying statements of operations.
Advertising Costs
Advertising costs are expensed as incurred. Advertising costs amounted to $1,340, $1,391, and $439 for the years ended December 31, 2012, 2013, 2014 respectively.
Stock-Based Compensation
The Company recognizes compensation expense for all stock-based payment arrangements, net of an estimated forfeiture rate, over the requisite service period of the award. For stock options, the Company determines the grant date fair value using the Black-Scholes option pricing model, which requires the input of certain assumptions, including the expected life of the stock-based payment awards, stock price volatility and risk-free interest rates. For restricted stock units, the Company determines the grant date fair value based on the closing market price of its common stock on the date of grant.
Foreign Currency Translation
In accordance with FASB authoritative guidance, the Company uses the local currency as the functional currency of its foreign subsidiaries. Accordingly, all assets and liabilities outside the United States are translated into U.S. dollars at the rate of exchange in effect at the balance sheet date. Revenue and expense items are translated at the weighted-average exchange rates prevailing during the period. Net foreign currency translation adjustments are recorded as accumulated other comprehensive income (loss) in stockholders' equity.
Foreign currency transactions occur when there is a transaction denominated in other than the respective entity's functional currency. The Company records the changes in the exchange rate for these transactions in the consolidated statements of operations. For the fiscal years ended December 31, 2012, 2013 and 2014, foreign exchange transaction gains and (losses) were included in other income (expense) and were $678, $(1,196), and $(3,188) respectively.
Income Taxes
Income taxes are computed using the asset and liability method. Under this method, deferred income taxes are recognized by applying enacted statutory tax rates applicable to future years to differences between the tax bases and financial carrying amounts of existing assets and liabilities. Valuation allowances are established when it is more likely than not that such deferred tax assets will not be realized.
The Company has a recognition threshold and a measurement attribute for the financial statement recognition and measurement of tax positions taken or expected to be taken in a tax return. For those benefits to be recognized, a tax position must be more likely than not to be sustained upon examination by taxing authorities based on the technical merits of the position. The amount recognized
73
CLEAN ENERGY FUELS CORP. AND SUBSIDIARIES
NOTES TO CONSOLIDATED FINANCIAL STATEMENTS (Continued)
(In thousands, except share and per share data)
(1) Summary of Significant Accounting Policies (Continued)
is measured as the largest amount of benefit that has a greater than 50 percent likelihood of being realized upon ultimate settlement. The Company recognizes potential accrued interest and penalties related to unrecognized tax benefit in income tax expense.
Net Loss Per Share
Basic net loss per share is computed by dividing net loss attributable to Clean Energy Fuels Corp. by the weighted-average number of common shares outstanding and common shares issuable for little or no cash consideration during the period. Diluted net loss per share is computed by dividing net loss attributable to Clean Energy Fuels Corp. by the weighted-average number of common shares outstanding and common shares issuable for little or no cash consideration and potentially dilutive securities outstanding during the period. Potentially dilutive securities include stock options, warrants, convertible notes and restricted stock units. The dilutive effect of stock options and warrants is computed under the treasury stock method. The dilutive effect of convertible notes and restricted stock units is computed under the if-converted method. Potentially dilutive securities are excluded from the computations of diluted net loss per share if their effect would be antidilutive. In 2013, 5,000,000 shares of common stock related to the GE Warrant, as defined and described in notes 9 and 11, were included in the basic and dilutive net loss per share calculation. On September 11, 2014, the Company determined it no longer met certain conditions required to include 4,000,000 shares of common stock related to the GE Warrant in its weighted average share calculations. As a result, from September 11, 2014 the Company (i) excluded 4,000,000 shares of common stock issuable upon exercise of the GE Warrant from the weighted average number of shares outstanding in the basic and diluted net loss per share calculations, and (ii) included the remaining 1,000,000 shares of common stock issuable upon exercise of the GE Warrant in the basic and diluted net loss per share calculations, as 500,000 shares were exercisable in 2012 as of the execution of the associated Credit Agreement, as defined and described in note 9, and an additional 500,000 shares became exercisable on December 31, 2014 in connection with the amendment to the Credit Agreement on December 29, 2014.
The following potentially dilutive securities have been excluded from the diluted net loss per share calculations because their effect would have been antidilutive:
|
|
2012 | 2013 | 2014 | |||||||
|---|---|---|---|---|---|---|---|---|---|---|
Stock options |
12,083,677 | 11,526,998 | 11,486,301 | |||||||
Warrants |
2,130,682 | 2,130,682 | 6,130,682 | |||||||
Convertibles notes |
16,262,226 | 35,185,979 | 35,185,979 | |||||||
Restricted stock units |
1,545,000 | 1,590,836 | 2,591,752 | |||||||
Comprehensive Income (Loss)
Comprehensive income (loss) is defined as the change in equity (net assets) of a business enterprise during the period from transactions and other events and circumstances from non-owner sources. The difference between net income and comprehensive income for the years ended December 31, 2012, 2013, and 2014 was primarily comprised of the Company's foreign currency translation adjustments and unrealized gains (losses) on futures contracts. During 2014, the Company
74
CLEAN ENERGY FUELS CORP. AND SUBSIDIARIES
NOTES TO CONSOLIDATED FINANCIAL STATEMENTS (Continued)
(In thousands, except share and per share data)
(1) Summary of Significant Accounting Policies (Continued)
converted a long-term equity intra-entity investment to equity and the related translation adjustments were reclassified to additional paid-in capital.
Concentration of Credit Risk
Credit is extended to all customers based on financial condition, and collateral is generally not required. Concentrations of credit risk with respect to trade receivables are limited because of the large number of customers comprising the Company's customer base and dispersion across many different industries and geographies. However, certain international customers have historically been slower to pay on trade receivables. Accordingly, the Company continuously monitors collections and payments from its customers and maintains a provision for estimated credit losses based upon its historical experience and any specific customer collection issues that it has identified. In addition, through Export Development Canada, IMW maintains accounts receivable insurance on a substantial portion of its foreign trade receivables, which covers up to 90% of the related outstanding balance. Although credit losses have historically been within the Company's expectations and the provisions established, the Company cannot guarantee that it will continue to experience the same credit loss rates that it has in the past.
The Company places its cash and cash equivalents with high credit quality financial institutions. At times, such investments may be in excess of the Federal Deposit Insurance Corporation ("FDIC"), Canadian Deposit Insurance Corporation ("CDIC"), and other foreign insurance limits. Financial instruments that potentially subject the Company to concentrations of credit risk consist principally of cash deposits. The amounts in excess of FDIC insurance limits were $237,004 and $88,740 as of December 31, 2013 and 2014, respectively.
Recently Adopted Accounting Changes and Recently Issued and Adopted Accounting Standards
On April 10, 2014, the Company adopted Accounting Standards Update ("ASU") No. 2014-08, Presentation of Financial Statements (Topic 205) and Property, Plant, and Equipment (Topic 360), Reporting Discontinued Operations and Disclosures of Disposals of Components of an Entity. The ASU provides new guidance that raises the threshold for disposals to qualify as discontinued operations by focusing on strategic shifts that have or will have a major effect on an entity's operations and financial results. The guidance allows companies to have significant continuing involvement and continuing cash flows with the disposed component. The Company early adopted this standard. On December 29, 2014, the Company disposed of its 51% ownership in its subsidiary DCE (as defined in note 2), which was not material to the operations and financial results nor a strategic shift of the Company. See note 2 for further discussion.
On May 28, 2014, the FASB issued ASU No. 2014-09, Revenue from Contracts with Customers, amending revenue recognition guidance and requiring more detailed disclosures to enable users of financial statements to understand the nature, amount, timing, and uncertainty of revenue and cash flows arising from contracts with customers. The guidance is effective for annual and interim reporting periods beginning after December 15, 2016, with early adoption prohibited. The Company is currently evaluating the impact this ASU will have on its consolidated financial statements.
75
CLEAN ENERGY FUELS CORP. AND SUBSIDIARIES
NOTES TO CONSOLIDATED FINANCIAL STATEMENTS (Continued)
(In thousands, except share and per share data)
(1) Summary of Significant Accounting Policies (Continued)
On August 27, 2014, the FASB issued ASU No. 2014-15, to communicate amendments to FASB Account Standards Codification Subtopic 205-40, "Disclosure of Uncertainties about an Entity's Ability to Continue as a Going Concern." The ASU requires management to evaluate relevant conditions, events and certain management plans that are known or reasonably knowable as of the evaluation date when determining whether substantial doubt about an entity's ability to continue as a going concern exists. Management will be required to make this evaluation for both annual and interim reporting periods. Management will need to make certain disclosures if it concludes that substantial doubt exists or when it plans to alleviate substantial doubt about the entity's ability to continue as a going concern. The standard is effective for annual periods ending after December 15, 2016 and for interim reporting periods starting in the first quarter of 2017. Early adoption is permitted. The Company does not expect the adoption of the guidance to have a material impact on its consolidated financial statements.
(2) Acquisitions and Divestitures
BAF
On June 28, 2013, the Company, entered into and closed a stock purchase agreement (the "BAF Sale Agreement") with Westport Innovations Inc. ("Westport") and Westport Innovations (U.S.) Holdings Inc., a wholly owned subsidiary of Westport (together with Westport, the "Westport Parties"). Under the terms of the BAF Sale Agreement, on June 28, 2013, the Westport Parties purchased all of the outstanding capital stock of BAF Technologies, Inc. ("BAF"), including BAF's 100% ownership interest of ServoTech Engineering, Inc., for 816,460 shares of Westport's common stock. Pursuant to the BAF Sale Agreement, the Company was issued 718,485 shares of Westport's common stock on June 28, 2013 and 97,975 shares of Westport's common stock (the "Holdback Shares") were retained by Westport for one year as security for the Company's indemnification obligations under the BAF Sale Agreement. At the end of June 2014, the Company was issued 94,914 of the Holdback Shares, with the remaining 3,061 Holdback Shares remaining unissued as a result of, and in full satisfaction of, an indemnity claim under the BAF Sale Agreement. In July 2013, the Company sold the 718,485 shares it initially received for net proceeds of $23,722. In July 2014, the Company sold all of the Holdback Shares it received for net proceeds of $1,727. Further, during August 2013, the Westport Parties repaid $2,478 of certain intercompany indebtedness of BAF to the Company following the conclusion of applicable post-closing adjustment procedures contemplated in the BAF Sale Agreement.
The fair value of the 816,460 shares of Westport's common stock on June 28, 2013 was $27,221, and the Company recognized an initial gain of $15,498 on June 28, 2013 related to the transaction. In December 2013, the Company wrote down the value of the Holdback Shares by $1,383, which resulted in an adjusted gain of $14,115 on the transaction. In July 2014, the Company wrote down the value of the Holdback Shares by an additional $122, which resulted in an adjusted gain of $13,993 on the transaction. The value of the shares received has been excluded from the Company's consolidated statements of cash flows as it is a non-cash investing activity. The gain was recorded in the line item gain from sale of subsidiary in the Company's consolidated statements of operations.
In addition, pursuant to the BAF Sale Agreement, the Company, Westport Power Inc. and Westport Fuel Systems Inc. (Westport Power, Inc. and Westport Fuel Systems, Inc. are collectively referred to as the "Westport Affiliates") entered into a marketing agreement, dated June 28, 2013, whereby the Westport Affiliates agreed to pay the Company $5,000 in cash, which was received on
76
CLEAN ENERGY FUELS CORP. AND SUBSIDIARIES
NOTES TO CONSOLIDATED FINANCIAL STATEMENTS (Continued)
(In thousands, except share and per share data)
(2) Acquisitions and Divestitures (Continued)
February 27, 2014. Under the marketing agreement, the Company and the Westport Affiliates agreed to collaborate during a two year period to encourage sales of all BAF products and certain vehicle products offered by the Westport Affiliates, and the Company agreed to provide 750,000 complimentary gasoline gallon equivalents of CNG to be used by the Westport Affiliates as marketing incentives. Additionally, the marketing agreement provides for the Company's appointment of a product line manager for BAF, and at least one member of a newly established operating committee formed to create sales and marketing strategies for BAF and assist in BAF's performance of these strategies.
MGES
On May 6, 2013, the Company entered into and closed a stock purchase agreement with Mansfield Energy Corp. ("Mansfield") and its wholly owned subsidiary Mansfield Gas Equipment Systems Corporation ("MGES"). MGES is primarily engaged in the business of providing CNG station design and construction and CNG equipment repair and maintenance services. Under the terms of the stock purchase agreement, the Company purchased from Mansfield all of the outstanding capital stock of MGES for $20,000, payable 50% in cash and 50% in shares of the Company's common stock. Upon closing, the Company delivered $9,000 in cash and 761,545 shares of the Company's common stock, and retained $1,000 as security for Mansfield's indemnification obligations under the stock purchase agreement. On the first anniversary of the closing date, the Company delivered the retained amount of $1,000 to Mansfield. In addition, in August 2013, the Company paid Mansfield an additional $563 following the conclusion of applicable post-closing adjustment procedures contemplated by the stock purchase agreement. The fair value of the Company's common stock delivered to Mansfield is excluded from the Company's consolidated statements of cash flows as it is a non-cash investing activity. The Company filed with the Securities and Exchange Commission a registration statement covering the resale of such shares, and the registration statement was declared effective in August 2013.
The Company accounted for this acquisition in accordance with FASB authoritative guidance for business combinations, which requires the Company to recognize the assets acquired and the liabilities assumed, measured at their fair values, as of the date of acquisition. The following table summarizes the allocation of the aggregate purchase price to the fair value of the assets acquired and liabilities assumed:
Current assets |
$ | 4,475 | ||
Property, plant and equipment |
1,369 | |||
Identifiable intangible assets |
600 | |||
Goodwill |
16,555 | |||
| | | | | |
Total assets acquired |
22,999 | |||
Current liabilities assumed |
(1,984 | ) | ||
| | | | | |
Total purchase price |
$ | 21,015 | ||
| | | | | |
| | | | | |
| | | | | |
Management allocated approximately $600 of the purchase price to the identifiable intangible assets related to customer relationships and project back-orders that were acquired with the acquisition. The fair value of the identifiable intangible assets will be amortized on a straight-line basis over the estimated useful lives of such assets ranging from one to six years. The excess of the purchase price
77
CLEAN ENERGY FUELS CORP. AND SUBSIDIARIES
NOTES TO CONSOLIDATED FINANCIAL STATEMENTS (Continued)
(In thousands, except share and per share data)
(2) Acquisitions and Divestitures (Continued)
over the fair value of net assets acquired was allocated to goodwill, which primarily represents additional market share available to the Company as a result of the acquisition, and is fully deductible for income tax purposes.
The results of operations of MGES have been included in the Company's consolidated financial statements since May 6, 2013. The historical results of MGES's operations were not material to the Company's financial position or historical results of operations.
NG Advantage
On October 14, 2014, the Company entered a Common Unit Purchase Agreement ("UPA") with NG Advantage, LLC ("NG Advantage"). NG Advantage is engaged in the business of transporting CNG in high-capacity trailers to large industrial and institutional energy users, such as hospitals, food processors, manufacturers and paper mills, which do not have direct access to natural gas pipelines. The Company viewed the acquisition as a strategic investment in the expansion of the Company's initiative to deliver natural gas to industrial and institutional energy users. Under the terms of the UPA, the Company paid NG Advantage $37,650 for a 53.3% controlling interest in NG Advantage. $19,000 of the purchase price was paid in cash on October 14, 2014 and the remaining $18,650 of the purchase price was paid in the form of an unsecured promissory note issued by the Company (the "NG Advantage Note"). The principal amount of the NG Advantage Note is payable by the Company in two payments as follows: (i) $3,000 was paid January 13, 2015 and (ii) the remaining $15,650 is due no later than April 1, 2015. The NG Advantage Note does not bear interest. The fair value of the NG Advantage Note delivered to NG Advantage is excluded from the Company's consolidated statements of cash flows as it is a non-cash investing activity. The consideration paid is accounted for as an intercompany transaction, as NG Advantage's financial results are included in the Company's consolidated financial statements.
The Company accounted for this acquisition in accordance with FASB authoritative guidance for business combinations, which requires the Company to recognize the assets acquired and the liabilities assumed, measured at their fair values, as of the date of acquisition. The following table summarizes
78
CLEAN ENERGY FUELS CORP. AND SUBSIDIARIES
NOTES TO CONSOLIDATED FINANCIAL STATEMENTS (Continued)
(In thousands, except share and per share data)
(2) Acquisitions and Divestitures (Continued)
the allocation of the aggregate purchase price to the preliminary fair value of the assets acquired and liabilities assumed:
Current assets |
$ | 40,558 | ||
Property, plant and equipment |
20,862 | |||
Other long-term assets |
5,115 | |||
Identifiable intangible assets |
5,600 | |||
Goodwill |
21,070 | |||
| | | | | |
Total assets acquired |
93,205 | |||
Current liabilities assumed |
(9,165 | ) | ||
| | | | | |
Long-term debt including capital leases assumed, excluding current installments |
(17,604 | ) | ||
Other liabilities |
(711 | ) | ||
| | | | | |
Non-controlling interest |
(28,075 | ) | ||
| | | | | |
Total purchase price |
$ | 37,650 | ||
| | | | | |
| | | | | |
| | | | | |
In connection with its purchase of a controlling interest in NG Advantage, the Company assumed debt of $20,439 on a consolidated basis related to purchases of capital assets and working capital needs. Immediately after the Company's purchase of the controlling interest, $10,361 of such debt was paid with proceeds of the Company's investment in NG Advantage, and the related debt instruments were cancelled.
Management allocated approximately $5,600 of the purchase price to the identifiable intangible assets related to customer relationships and trade names that were acquired with the acquisition. The fair value of the identifiable intangible assets will be amortized on a straight-line basis over the estimated useful lives of such assets ranging from four to seven years. The excess of the purchase price over the fair value of net assets acquired was allocated to goodwill, which primarily represents additional market share available to the Company as a result of the acquisition, and is fully deductible for income tax purposes.
Management determined the fair value of the non-controlling interest to be $28,075 using a market approach and using inputs that included use of a comparable transaction to calculate the value of the non-controlling interest adjusted for a control premium.
The results of NG Advantage's operations have been included in the Company's consolidated financial statements since October 14, 2014. The historical results of NG Advantage's operations were not material to the Company's financial position or historical results of operations.
DCE and DCEMB
On September 4, 2014, Mavrix, LLC ("Mavrix"), a wholly owned subsidiary of the Company, sold to Cambrian Energy McCommas Bluff III LLC ("Cambrian") 19% of its then-70% interest in Dallas Clean Energy, LLC ("DCE"). On December 29, 2014, Mavrix entered into a Membership Interest Purchase Agreement (the "Agreement") with Cambrian, pursuant to which Mavrix sold to Cambrian its
79
CLEAN ENERGY FUELS CORP. AND SUBSIDIARIES
NOTES TO CONSOLIDATED FINANCIAL STATEMENTS (Continued)
(In thousands, except share and per share data)
(2) Acquisitions and Divestitures (Continued)
entire remaining 51% interest in DCE. DCE owns all of the equity interests in Dallas Clean Energy McCommas Bluff, LLC ("DCEMB"), which owns a renewable natural gas extraction and processing project at the McCommas Bluff landfill in Dallas, Texas. As consideration for the sale of DCE, the Company, through Mavrix, received $6,992 in cash in September 2014 and $40,588 in cash in December 2014 and may receive up to an additional $3,000 in cash on or before August 14, 2015, subject to the results of certain performance tests to be performed at the McCommas Bluff project on or before August 1, 2015 in accordance the terms of the Agreement. Prior to December 29, 2014, Cambrian owned a 49% interest in DCE. The Company will continue to have the right to market and sell biomethane produced at the McCommas Bluff project under its Redeem renewable natural gas vehicle fuel brand. The transaction resulted in a gain of $11,998 that was recorded in the line item gain from the sale of subsidiary in the Company's consolidated statement of operations. Included in the determination of the gain is goodwill of $7,205 that was allocated to the transaction in accordance with FASB authoritative guidance for subsequent measure of goodwill which requires the Company to allocate goodwill to the disposed business based on the relative fair values of the business disposed and the portion of the reporting unit that was retained.
The Company determined, in accordance with FASB authoritative guidance, that the disposal did not meet the definition of a discontinued operation as the disposal did not represent a significant disposal nor was the disposal a strategic shift in the Company's strategy.
(3) Restricted Cash
The Company classifies restricted cash as short-term and a current asset if the cash is expected to be used in operations within a year or to acquire a current asset. Otherwise, the restricted cash is classified as long-term. Restricted cash consisted of the following as of December 31, 2013 and 2014:
|
|
December 31, 2013 |
December 31, 2014 |
|||||
|---|---|---|---|---|---|---|---|
Short-term restricted cash |
|||||||
Standby letters of credit |
$ | 1,822 | $ | 1,753 | |||
DCEMB revenue bonds |
6,581 | | |||||
Canton bonds |
| 4,259 | |||||
| | | | | | | | |
Total short-term restricted cash |
$ | 8,403 | $ | 6,012 | |||
| | | | | | | | |
| | | | | | | | |
| | | | | | | | |
(4) Investments
Available-for-sale investments are carried at fair value, inclusive of unrealized gains and losses. Net unrealized gains and losses are included in other comprehensive income (loss) net of applicable income taxes. Gains or losses on sales of available-for-sale investments are recognized on the specific identification basis. All of the Company's short-term investments are classified as available-for-sale securities.
The Company reviews available-for-sale investments for other- than-temporary declines in fair value below their cost basis each quarter, and whenever events or changes in circumstances indicate that the cost basis of an asset may not be recoverable. This evaluation is based on a number of factors,
80
CLEAN ENERGY FUELS CORP. AND SUBSIDIARIES
NOTES TO CONSOLIDATED FINANCIAL STATEMENTS (Continued)
(In thousands, except share and per share data)
(4) Investments (Continued)
including the length of time and the extent to which the fair value has been below its cost basis and adverse conditions related specifically to the security, including any changes to the credit rating of the security. As of December 31, 2014, the Company believes its carrying values for its available-for-sale investments are properly recorded.
Short-term investments as of December 31, 2013 are summarized as follows:
|
|
Amortized Cost |
Gross Unrealized Losses |
Estimated Fair Value |
|||||||
|---|---|---|---|---|---|---|---|---|---|---|
Municipal bonds & notes |
$ | 60,047 | $ | (252 | ) | $ | 59,795 | |||
Corporate bonds |
43,166 | (342 | ) | 42,824 | ||||||
Certificate of deposits |
35,630 | (9 | ) | 35,621 | ||||||
| | | | | | | | | | | |
Total short-term investments |
$ | 138,843 | $ | (603 | ) | $ | 138,240 | |||
| | | | | | | | | | | |
| | | | | | | | | | | |
| | | | | | | | | | | |
Short-term investments as of December 31, 2014 are summarized as follows:
|
|
Amortized Cost |
Gross Unrealized Losses |
Estimated Fair Value |
|||||||
|---|---|---|---|---|---|---|---|---|---|---|
Municipal bonds & notes |
$ | 38,668 | $ | (16 | ) | $ | 38,652 | |||
Zero coupon bonds |
3,308 | (2 | ) | 3,306 | ||||||
Corporate bonds |
45,274 | (41 | ) | 45,233 | ||||||
Certificate of deposits |
35,355 | | 35,355 | |||||||
| | | | | | | | | | | |
Total short-term investments |
$ | 122,605 | $ | (59 | ) | $ | 122,546 | |||
| | | | | | | | | | | |
| | | | | | | | | | | |
| | | | | | | | | | | |
(5) Other Receivables
Other receivables at December 31, 2013 and 2014 consisted of the following:
|
|
2013 | 2014 | |||||
|---|---|---|---|---|---|---|---|
Loans to customers to finance vehicle purchases |
$ | 5,919 | $ | 8,257 | |||
Accrued customer billings |
6,327 | 10,143 | |||||
Fuel tax and carbon credits |
6,740 | 34,250 | |||||
Other |
7,299 | 3,573 | |||||
| | | | | | | | |
|
$ | 26,285 | $ | 56,223 | |||
| | | | | | | | |
| | | | | | | | |
| | | | | | | | |
81
CLEAN ENERGY FUELS CORP. AND SUBSIDIARIES
NOTES TO CONSOLIDATED FINANCIAL STATEMENTS (Continued)
(In thousands, except share and per share data)
(6) Land, Property and Equipment
Land, property and equipment at December 31, 2013 and 2014 are summarized as follows:
|
|
2013 | 2014 | |||||
|---|---|---|---|---|---|---|---|
Land |
$ | 1,707 | $ | 2,858 | |||
LNG liquefaction plants |
93,685 | 94,636 | |||||
RNG plants |
47,932 | 45,359 | |||||
Station equipment |
194,240 | 265,086 | |||||
LNG trailers |
22,667 | 40,067 | |||||
Other equipment |
62,127 | 74,796 | |||||
Construction in progress |
204,548 | 163,737 | |||||
| | | | | | | | |
|
626,906 | 686,539 | |||||
Less accumulated depreciation |
(139,052 | ) | (172,270 | ) | |||
| | | | | | | | |
|
$ | 487,854 | $ | 514,269 | |||
| | | | | | | | |
| | | | | | | | |
| | | | | | | | |
Included in the land, property and equipment are capitalized software costs of $18,214 and $21,004 as of December 31, 2013 and December 31, 2014, respectively. The accumulated amortization on the capitalized software costs is $7,747 and $10,740 as of December 31, 2013 and December 31, 2014, respectively. The Company recorded $1,812, $3,079, and $2,993 of amortization expense related to the capitalized software costs in 2012, 2013 and 2014, respectively.
As of December 31, 2013 and 2014, $13,930 and $11,032, respectively, are included in accounts payable balances, which amounts are related to additions of property and equipment within the respective year. These amounts are excluded from the consolidated statements of cash flows as they are non-cash investing activities.
(7) Investment in Other Entities
The Company previously invested in Clean Energy del Peru ("Peru JV"), a former joint venture in Peru that operated CNG stations. The Company accounted for its investment in Peru JV under the equity method of accounting as the Company had the ability to exercise significant influence over Peru JV's operations while the Company maintained an ownership interest in Peru JV. In March 2013, the Company completed the sale of its entire ownership interest in Peru JV for $6,119 after receiving a dividend distribution of $1,091, and recognized a gain of $4,705.
On September 16, 2014, the Company formed a joint venture with Mansfield called Mansfield Clean Energy Partners LLC ("MCEP") , which is designed to provide natural gas fueling solutions to bulk fuel haulers in the U.S. The Company and Mansfield each have a 50% ownership interest in MCEP. The Company accounts for its interest using the equity method of accounting as the Company has the ability to exercise significant influence over MCEP's operations. The Company recorded a loss from this investment of $490 and has an investment balance of $5,510 at December 31, 2014.
82
CLEAN ENERGY FUELS CORP. AND SUBSIDIARIES
NOTES TO CONSOLIDATED FINANCIAL STATEMENTS (Continued)
(In thousands, except share and per share data)
(8) Accrued Liabilities
Accrued liabilities at December 31, 2013 and 2014 consisted of the following:
|
|
2013 | 2014 | |||||
|---|---|---|---|---|---|---|---|
Salaries and wages |
$ | 6,768 | $ | 9,041 | |||
Accrued gas and equipment purchases |
8,035 | 12,340 | |||||
Accrued property and other taxes |
5,448 | 5,178 | |||||
Accrued professional fees |
1,335 | 1,084 | |||||
Accrued employee benefits |
2,898 | 3,208 | |||||
Accrued warranty liability |
2,545 | 2,302 | |||||
Accrued interest |
4,216 | 3,748 | |||||
Other |
15,500 | 19,859 | |||||
| | | | | | | | |
|
$ | 46,745 | $ | 56,760 | |||
| | | | | | | | |
| | | | | | | | |
| | | | | | | | |
(9) Long-Term Debt
DCEMB Revenue Bonds
On December 29, 2014, the Company sold its interest in DCE and its wholly owned subsidiary DCEMB. DCEMB's obligations to pay amounts due under certain tax-exempt revenue bonds issued in 2011 were included in the sale and, as a result, are not obligations of the Company as of the date of such sale. Such revenue bonds were previously included as an investing activity in the consolidated statement of cash flows, and the sale of such revenue bonds was included in the consolidated statement of operations in the line item gain from sale of subsidiary.
IMW Notes
In connection with the closing of the Company's acquisition of IMW, the Company agreed to make future payments consisting of four annual payments in the amount of $5,000 in Canadian dollars ("CAD") and $7,500 in U.S. dollars (each an "IMW Note" and collectively, the "IMW Notes") , all of which had been paid as of February 2014. Each payment under the IMW Notes consisted of CAD$5,000 in cash and $7,500 in cash and/or shares of the Company's common stock (the exact combination of cash and/or stock was determined by the Company in its discretion). In January 2011, the Company paid $5,000 in cash and $7,500 in shares of its common stock. The Company paid CAD$5,000 in cash in January 2012 and $3,750 in shares of its common stock in each of August 2012 and October 2012. The Company paid CAD$5,000 in cash and $7,500 in shares of its common stock in February 2013. In February 2014, the Company paid the final payment of CAD$5,000 in cash, $3,750 in cash and $3,750 in shares of its common stock. The IMW Notes that were settled with shares of the Company's common stock are not included in the consolidated statements of cash flows as they are non-cash financing activities.
HSBC Lines of Credit
In connection with the closing of the Company's acquisition of IMW, the Company entered into an Assumption Agreement (the "Assumption Agreement") with HSBC Bank Canada ("HSBC") pursuant
83
CLEAN ENERGY FUELS CORP. AND SUBSIDIARIES
NOTES TO CONSOLIDATED FINANCIAL STATEMENTS (Continued)
(In thousands, except share and per share data)
(9) Long-Term Debt (Continued)
to which the Company assumed the obligations and liabilities of IMW under the following arrangements with HSBC (collectively, the "IMW Lines of Credit"):
- (i)
- An
operating line of credit with a limit of CAD $13,000 to assist in financing the day-to-day working capital needs of IMW. The interest on amounts
outstanding is payable at IMW's option at (a) HSBC's Prime Rate plus 1.00% per annum, (b) HSBC's U.S. Base Rate plus 1.00% per annum, or LIBOR plus 2.25% per annum, subject to
availability.
- (ii)
- A
demand revolving line of credit with a limit of CAD$2,000 bearing interest at the same rate as that of the operating line of credit discussed above, to
assist in financing IMW's import requirements.
- (iii)
- A
demand revolving bank guarantee and standby letter of credit line with a limit of CAD$1,115.
- (iv)
- A
bank guarantee line with a limit of CAD$3,000, which allows IMW to provide guarantees and/or standby letters of credit to overseas suppliers or
bid/performance deposits on contracts.
- (v)
- A
forward exchange contract line with a limit of CAD$13,750 that allows IMW to enter into foreign exchange forward contracts up to the notional limit of
CAD$13,750.
- (vi)
- An
operating line of credit with a limit of 5,000 Renminbi ("RMB") (CAD$945) bearing interest at the 6 month People's Bank of China rate plus 2.5%
and a sub-limit bank guarantee line of 5,000 RMB. The aggregate of the balances in the lines cannot exceed 5,000 RMB.
- (vii)
- A
16,750 Bangladeshi Taka (CAD$245) operating line of credit bearing interest at 14%.
- (viii)
- A 170,000 Colombian Peso (CAD$82) operating line of credit bearing interest at the Colombia benchmark rate plus 7 to 12%.
The IMW Lines of Credit were secured by a general security agreement providing a first priority security interest in all present and after acquired personal property of IMW. On October 2, 2014, the Company paid the outstanding balance on (i) above and it, along with a (ii), (iv) and (v) above, was cancelled. The outstanding balances under the remaining arrangements described above are included in Other Debt in the long-term debt summary table below.
7.5% Notes
On July 11, 2011, the Company entered into a loan agreement (the "CHK Agreement") with Chesapeake NG Ventures Corporation ("Chesapeake"), an indirect wholly owned subsidiary of Chesapeake Energy Corporation, whereby Chesapeake agreed to purchase from the Company up to $150,000 of debt securities (the "CHK Financing") pursuant to the issuance of three convertible promissory notes, each having a principal amount of $50,000 (each a "CHK Note" and collectively the "CHK Notes" and, together with the CHK Agreement and other transaction documents, the "CHK Loan Documents"). The first CHK Note was issued on July 11, 2011 and the second CHK Note was issued on July 10, 2012.
On June 14, 2013 (the "Transfer Date"), Boone Pickens and Green Energy Investment Holdings, LLC, an affiliate of Leonard Green & Partners, L.P. (collectively, the "Buyers"), and
84
CLEAN ENERGY FUELS CORP. AND SUBSIDIARIES
NOTES TO CONSOLIDATED FINANCIAL STATEMENTS (Continued)
(In thousands, except share and per share data)
(9) Long-Term Debt (Continued)
Chesapeake entered into a note purchase agreement ("Note Purchase Agreement") pursuant to which Chesapeake sold the outstanding CHK Notes (the "Sale") to the Buyers. Chesapeake assigned to the Buyers all of its right, title and interest under the CHK Loan Documents (the "Assignment"), and each Buyer severally assumed all of the obligations of Chesapeake under the CHK Loan Documents arising after the Sale and the Assignment including, without limitation, the obligation to advance an additional $50,000 to the Company in June 2013 (the "Assumption"). The Company also entered into the Note Purchase Agreement for the purpose of consenting to the Sale, the Assignment and the Assumption.
Contemporaneously with the execution of the Note Purchase Agreement, the Company entered into a loan agreement with each Buyer (collectively, the "Amended Agreements"). The Amended Agreements have the same terms as the CHK Agreement, other than changes to reflect the change in ownership of the CHK Notes. Immediately following execution of the Amended Agreements, the Buyers delivered $50,000 to the Company in satisfaction of the funding requirement they had assumed from Chesapeake (the "June Advance"). In addition, the Company cancelled the existing CHK Notes and re-issued replacement notes, and the Company also issued notes to the Buyers in exchange for the June Advance (the re-issued replacement notes and the notes issued in exchange for the June Advance are referred to herein as the "7.5% Notes").
The 7.5% Notes have the same terms as the original CHK Notes, other than the changes to reflect their different holders. They bear interest at the rate of 7.5% per annum and are convertible at the option of the holder into shares of the Company's common stock at a conversion price of $15.80 per Share (the "7.5% Notes Conversion Price"). Upon written notice to the Company, the holders of the 7.5% Notes have the right to exchange all or a portion of the principal and accrued and unpaid interest under each such note for shares of the Company's common stock at the 7.5% Notes Conversion Price. Additionally, subject to certain restrictions, the Company can force conversion of each 7.5% Note into shares of the its common stock if, following the second anniversary of the issuance of a 7.5% Note, such shares trade at a 40% premium to the 7.5% Notes Conversion Price for at least 20 trading days in any consecutive 30 trading day period. The entire principal balance of each 7.5% Note is due and payable seven years following its issuance and the Company may repay each 7.5% Note in shares of its common stock or cash. All of the shares issuable upon exercise of the 7.5% Notes have been registered for resale by their holders pursuant to a registration statement that has been filed with and declared effective by the Securities and Exchange Commission. The Amended Agreements restrict the use of the proceeds of the 7.5% Notes to financing the development, construction and operation of LNG stations and payment of certain related expenses. The Amended Agreements also provide for customary events of default which, if any of them occurs, would permit or require the principal of, and accrued interest on, the 7.5% Notes to become, or to be declared, due and payable.
On August 27, 2013, Green Energy Investment Holdings, LLC transferred $5,000 in principal amount of the 7.5% Notes to certain third parties.
As a result of the foregoing transactions, (i) Mr. Pickens holds 7.5% Notes in the aggregate principal amount of $65,000, which 7.5% Notes are convertible into approximately 4,113,924 shares of the Company's common stock, and (ii) Green Energy Investment Holdings, LLC holds 7.5% Notes in the aggregate principal amount of $80,000, which 7.5% Notes are convertible into approximately 5,063,291 shares of the Company's common stock.
85
CLEAN ENERGY FUELS CORP. AND SUBSIDIARIES
NOTES TO CONSOLIDATED FINANCIAL STATEMENTS (Continued)
(In thousands, except share and per share data)
(9) Long-Term Debt (Continued)
At December 31, 2014, none of the proceeds from the 7.5% Notes were included in restricted cash as the Company had used the funds primarily to build LNG fueling stations.
SLG Notes
On August 24, 2011, the Company entered into convertible note purchase agreements (each, an "SLG Agreement" and collectively the "SLG Agreements") with each of Springleaf Investments Pte. Ltd., a wholly-owned subsidiary of Temasek Holdings Pte. Ltd., Lionfish Investments Pte. Ltd., an investment vehicle managed by Seatown Holdings International Pte. Ltd., and Greenwich Asset Holding Ltd., a wholly-owned subsidiary of RRJ Capital Master Fund I, L.P. (each, a "Purchaser" and collectively, the "Purchasers"), whereby the Purchasers agreed to purchase from the Company $150,000 of 7.5% convertible notes due in August 2016 (each a "SLG Note" and collectively the "SLG Notes"). The transaction closed and the SLG Notes were issued on August 30, 2011. On March 1, 2012, Springleaf Investments Pte. LTD transferred $24,000 principal amount of the SLG Notes to Baytree Investments (Mauritius) Pte Ltd.
The SLG Notes bear interest at the rate of 7.5% per annum and are convertible at each Purchaser's option into shares of the Company's common stock at a conversion price of $15.00 per share (the "SLG Conversion Price"). Upon written notice to the Company, the holders of the SLG Notes have the right to exchange all or any portion of the principal and accrued and unpaid interest under each such note for shares of the Company's common stock at the SLG Conversion Price. Additionally, subject to certain restrictions, the Company can force conversion of each SLG Note into shares of its common stock if, following the second anniversary of the issuance of the SLG Notes, the such shares trade at a 40% premium to the SLG Conversion Price for at least 20 trading days in any consecutive 30 trading day period. The entire principal balance of each SLG Note is due and payable five years following its issuance, and the Company may repay the principal balance of each SLG Note in shares of its common stock or cash. All of the shares issuable upon exercise of the SLG Notes have been registered for resale by their holders pursuant to a registration statement that has been filed with and declared effective by the Securities and Exchange Commission. The SLG Agreements provide for customary events of default which, if any of them occurs, would permit or require the principal of, and accrued interest on, the SLG Notes to become, or to be declared, due and payable. In April 2012, $1,003 of principal and accrued interest under an SLG Note was converted by the holder thereof into 66,888 shares of the Company's common stock. In January and February 2013, $4,030 of principal and accrued interest under an SLG Note was converted by the holder thereof into 268,664 shares of the Company's common stock. Such conversions were not included in the consolidated statements of cash flows as they are a non-cash financing activity.
GE Loans
On November 7, 2012, the Company, through two wholly owned subsidiaries (the "Borrowers"), entered into a credit agreement ("Credit Agreement") with General Electric Capital Corporation ("GE"). Pursuant to the Credit Agreement, GE agreed to loan to the Borrowers up to an aggregate of $200,000 to finance the development, construction and operation of two LNG plants (individually a "Project" and together the "Projects").
86
CLEAN ENERGY FUELS CORP. AND SUBSIDIARIES
NOTES TO CONSOLIDATED FINANCIAL STATEMENTS (Continued)
(In thousands, except share and per share data)
(9) Long-Term Debt (Continued)
On December 29, 2014, the Borrowers and GE entered into an amendment to the Credit Agreement providing, among other things, that (i) the Credit Agreement will terminate if the initial loans under the Credit Agreement (collectively, "Loans" and, with respect to each Project "Tranche A Loans" and "Tranche B Loans") for the Projects are not made prior to December 31, 2016 (rather than December 31, 2014, as the Credit Agreement originally provided), (ii) each Project must be completed by the earlier of (a) the date that is thirty months after the funding of the initial Loans with respect to such Project and (b) December 31, 2018 (rather than December 31, 2016, as the Credit Agreement originally provided) (with respect to each Project, the "Date Certain"), and (iii) prior to the funding of the Loans, the Borrowers will be required to enter into agreements with GE Oil & Gas, Inc. relating to the purchase of equipment for the Projects.
The Borrowers' ability to obtain the Loans under the Credit Agreement is subject to the satisfaction of certain conditions, including each of the (i) acquisition of title to, or leasehold interests in, the sites upon which the Projects will be constructed, (ii) receipt of all governmental approvals necessary in connection with the design, development, ownership, construction, installation, operation and maintenance of the Projects, and (iii) commitment of all utility services necessary for the construction and operation of the Projects.
The Credit Agreement further provides that (i) the then existing Loans with respect to each Project must be converted into term loans with eight year amortization schedules ("Term Loans") on or before the Date Certain with respect to such Project (the date of such conversion with respect to each Project, the "Conversion Date"), provided that if such Loans are not converted into Term Loans by the applicable Date Certain, such Loans must be repaid by the applicable Date Certain, (ii) each Term Loan will be due and payable on the eighth anniversary of the Conversion Date with respect to such Term Loan, and (iii) at any time prior to the applicable Conversion Date, the Loans may be prepaid in whole, and at any time after the applicable Conversion Date, the Loans may be prepaid in whole or in part. The Company expects the Loans to bear interest at an annual rate equal to the then- current LIBOR rate plus 7.00%, provided that for purposes of the Credit Agreement, the then-current LIBOR rate will always be at least 1.00%. The Credit Agreement includes various customary covenants, including debt service coverage ratios, a commitment fee on the unutilized loan amounts of 0.5% per annum, and also provides for customary events of default which, if such events occur, would permit or require the Loans to become or to be declared due and payable. As of December 31, 2014, the Company has not drawn any money under the Credit Agreement and was in compliance with the financial covenants. The commitment fee, which is charged to interest expense in the consolidated statements of operations, was $1,014 for the years ended December 31, 2013 and 2014.
The Loans are secured by (i) a first priority security interest in all of the Borrowers' assets, including the Projects, and (ii) a pledge of the Borrowers' outstanding ownership interests. In addition, the Company has executed a guaranty in favor of GE ("Guaranty"), pursuant to which the Company has guaranteed all of the Borrowers' obligations under the Credit Agreement, including repayment of all Loans.
The Company and GE also entered an equity contribution agreement (the "EC Agreement") pursuant to which the Company agreed to pay at least 25% of the budgeted cost of the Projects and all additional costs that exceed such expected budgeted costs, in each case, in the form of equity contributions to the Borrowers ("Equity Contributions"). The EC Agreement also requires the
87
CLEAN ENERGY FUELS CORP. AND SUBSIDIARIES
NOTES TO CONSOLIDATED FINANCIAL STATEMENTS (Continued)
(In thousands, except share and per share data)
(9) Long-Term Debt (Continued)
Company to provide, concurrent with GE's extension of the initial Loans under the Credit Agreement, letter(s) of credit in an amount equal to the Company's then-current unfunded Equity Contributions.
Concurrently with the execution of the Credit Agreement, the Company issued to GE a warrant to purchase up to five million shares of its common stock (see note 11).
Mavrix Note
On April 25, 2013, Mavrix entered into a note purchase agreement (the "NPA") with Massachusetts Mutual Life Insurance (the "Note Purchaser") and issued to the Note Purchaser a secured multi-draw promissory note (the "Note") in the maximum aggregate principal amount of $30,000. The Note matured 12 years after its issuance date and bore interest at a rate of 12.0% per annum and paid in kind interest at a rate of 2.0% per annum. The Note Purchaser funded advances of $5,000 under the Note in each of April, September and December 2013.
In connection with the Company's sale of its interests in DCE and DCEMB, on December 29, 2014, Mavrix paid $13,594 to the Note Purchaser as payment in full of all outstanding indebtedness under the NPA and the Note. Such amount includes approximately $750 as payment of an early termination fee required pursuant to the terms of the NPA and the Note. Concurrently with such payment, the NPA, the Note and all other documents related thereto were terminated in full.
5.25% Notes
In September 2013, the Company completed a private offering of 5.25% Convertible Senior Notes due 2018 (the "5.25% Notes") and entered into an indenture governing the 5.25% Notes (the "Indenture").
The net proceeds from the sale of the 5.25% Notes after the payment of certain debt issuance costs of $7,805 were $242,195. The Company has used, and intends to continue to use, the net proceeds from the sale of the 5.25% Notes to fund capital expenditures and for general corporate purposes.
The 5.25% Notes bear interest at a rate of 5.25% per annum, payable semi- annually in arrears on October 1 and April 1 of each year, beginning on April 1, 2014. The 5.25% Notes will mature on October 1, 2018, unless purchased, redeemed or converted prior to such date in accordance with their terms and the terms of the Indenture.
Holders may convert their 5.25% Notes, at their option, at any time prior to the close of business on the business day immediately preceding the maturity date of the 5.25% Notes. Upon conversion, the Company will deliver a number of shares of its common stock, per $1 principal amount of 5.25% Notes, equal to the conversion rate then in effect (together with a cash payment in lieu of any fractional shares). The initial conversion rate for the 5.25% Notes is 64.1026 shares of the Company's common stock per $1 principal amount of Notes (which is equivalent to an initial conversion price of approximately $15.60 per share of the Company's common stock). The conversion rate is subject to adjustment upon the occurrence of certain specified events as described in the Indenture.
Upon the occurrence of certain corporate events prior to the maturity date of the 5.25% Notes, the Company will, in certain circumstances, in addition to delivering the number of shares of the Company's common stock deliverable upon conversion of the 5.25% Notes based on the conversion
88
CLEAN ENERGY FUELS CORP. AND SUBSIDIARIES
NOTES TO CONSOLIDATED FINANCIAL STATEMENTS (Continued)
(In thousands, except share and per share data)
(9) Long-Term Debt (Continued)
rate then in effect (together with a cash payment in lieu of any fractional shares), pay holders that convert their 5.25% Notes a cash make-whole payment in an amount as described in the Indenture. The Company may, at its option, irrevocably elect to settle its obligation to pay any such make-whole payment in shares of its common stock instead of in cash. The amount of any make-whole payment, whether it is settled in cash or in shares of the Company's common stock upon the Company's election, will be determined based on the date on which the corporate event occurs or becomes effective and the stock price paid (or deemed to be paid) per share of the Company's common stock in the corporate event, as described in the Indenture.
The Company may not redeem the 5.25% Notes prior to October 5, 2016. On or after October 5, 2016, the Company may, at its option, redeem for cash all or any portion of the 5.25% Notes if the closing sale price of the Company's common stock for at least 20 trading days (whether or not consecutive) during any 30 consecutive trading day period ending on, and including, the trading day immediately preceding the date on which notice of redemption is provided, exceeds 160% of the conversion price on each applicable trading day. In the event of the Company's redemption of the 5.25% Notes, the redemption price will equal 100% of the principal amount of the 5.25% Notes to be redeemed, plus accrued and unpaid interest to, but excluding, the redemption date. No sinking fund is provided for in the 5.25% Notes.
If the Company undergoes a fundamental change (as defined in the Indenture) prior to the maturity date of the 5.25% Notes, subject to certain conditions as described in the Indenture, holders may require the Company to purchase, for cash, all or any portion of their 5.25% Notes at a repurchase price equal to 100% of the principal amount of the 5.25% Notes to be repurchased, plus accrued and unpaid interest to, but excluding, the fundamental change purchase date.
The Indenture contains customary events of default with customary cure periods, including, without limitation, failure to make required payments or deliveries of shares of its common stock when due under the Indenture, failure to comply with certain covenants under the Indenture, failure to pay when due or acceleration of certain other indebtedness of the Company or certain of its subsidiaries, and certain events of bankruptcy and insolvency of the Company or certain of its subsidiaries. The occurrence of an event of default under the Indenture will allow either the trustee or the holders of at least 25% in principal amount of the then-outstanding 5.25% Notes to accelerate, or upon an event of default arising from certain events of bankruptcy or insolvency of the Company, will automatically cause the acceleration of, all amounts due under the 5.25% Notes. No events of default have occurred as of December 31, 2014.
The 5.25% Notes are senior unsecured obligations of the Company and rank senior in right of payment to the Company's future indebtedness that is expressly subordinated in right of payment to the 5.25% Notes; equal in right of payment to the Company's unsecured indebtedness that is not so subordinated; effectively junior to any of the Company's secured indebtedness to the extent of the value of the assets securing such indebtedness; and structurally junior to all indebtedness (including trade payables) of the Company's subsidiaries.
89
CLEAN ENERGY FUELS CORP. AND SUBSIDIARIES
NOTES TO CONSOLIDATED FINANCIAL STATEMENTS (Continued)
(In thousands, except share and per share data)
(9) Long-Term Debt (Continued)
Canton Bonds
On March 19, 2014, Canton Renewables LLC, ("Canton") a wholly owned subsidiary of the Company, completed the issuance of Solid Waste Facility Limited Obligation Revenue Bonds (Canton Renewables, LLCSauk Trail Hills Project) Series 2014 in the aggregate principal amount of $12,400 (the "Bonds").
The Bonds were issued by the Michigan Strategic Fund (the "Issuer") and the proceeds of the issuance were loaned by the Issuer to Canton pursuant to a loan agreement that became effective on March 19, 2014 (the "Loan Agreement"). The Bonds are expected to be repaid from revenue generated by Canton from the sale of RNG and are secured by the revenue and assets of Canton. The Bond repayments will be amortized through July 1, 2022, the average coupon interest rate on the Bonds is 6.6%, and all but $1,000 of the principal amount of the Bonds is non-recourse to Canton's parent companies, including the Company.
Canton used the Bond proceeds primarily to (i) refinance the cost of constructing and equipping its RNG extraction and production project in Canton, Michigan and (ii) pay a portion of the costs associated with the issuance of the Bonds. The refinancing described in the prior sentence was accomplished through distributions to the Borrower's direct and indirect parent companies who provided the financing for the RNG production facility, and such companies have used such distributions to finance construction of additional RNG extraction and processing projects and for working capital purposes.
The Loan Agreement contains customary events of default, with customary cure periods, including without limitation, failure to make required payments when due under the Loan Agreement, failure to comply with certain covenants under the Loan Agreement, certain events of bankruptcy and insolvency of Canton, and the existence of an event of default under the indenture governing the Bonds that was entered between the Issuer and The Bank of New York Mellon Trust Company, N.A., as trustee. The occurrence of an event of default under the Loan Agreement will allow the Issuer or the trustee to accelerate all amounts due under the Loan Agreement. As of December 31, 2014, Canton had met its obligations under the Loan Agreement.
Other Debt
The Company has other debt due at various dates through 2020 bearing interest at rates up to 21.42% and with a weighted average interest rate of 5.72% and 6.80% as of December 31, 2013 and 2014, respectively.
90
CLEAN ENERGY FUELS CORP. AND SUBSIDIARIES
NOTES TO CONSOLIDATED FINANCIAL STATEMENTS (Continued)
(In thousands, except share and per share data)
(9) Long-Term Debt (Continued)
Long-term debt and capital lease obligations at December 31, 2013 and 2014 consisted of the following:
|
|
December 31, 2013 |
December 31, 2014 |
|||||
|---|---|---|---|---|---|---|---|
IMW Notes |
$ | 12,121 | $ | | |||
DCEMB notes |
585 | | |||||
DCEMB revenue bonds |
36,500 | | |||||
7.5% Notes |
150,000 | 150,000 | |||||
SLG Notes |
145,000 | 145,000 | |||||
5.25% Notes |
250,000 | 250,000 | |||||
Note (non-recourse to the Company) |
15,097 | | |||||
Bonds ($11,150 non-recourse to the Company) |
| 12,150 | |||||
Capital lease obligations |
3,091 | 2,692 | |||||
Other debt |
8,024 | 10,828 | |||||
| | | | | | | | |
Total debt and capital lease obligations |
620,418 | 570,670 | |||||
Less amounts due within one year |
(23,401 | ) | (4,846 | ) | |||
| | | | | | | | |
Total long-term debt and capital lease obligations |
$ | 597,017 | $ | 565,824 | |||
| | | | | | | | |
| | | | | | | | |
| | | | | | | | |
The following is a summary of aggregate maturities of long-term debt and capital lease obligations for each of the years ending December 31:
|
|
2015 | 2016 | 2017 | 2018 | 2019 | Thereafter | |||||||||||||
|---|---|---|---|---|---|---|---|---|---|---|---|---|---|---|---|---|---|---|---|
7.5% Notes |
| | | 50,000 | 50,000 | 50,000 | |||||||||||||
SLG Notes |
| 145,000 | | | | | |||||||||||||
5.25% Notes |
| | | 250,000 | | | |||||||||||||
Canton Bonds ($11,150 non-recourse to the Company) |
1,240 | 1,390 | 1,420 | 1,460 | 1,555 | 5,085 | |||||||||||||
Capital lease obligations |
700 | 386 | 483 | 188 | 183 | 752 | |||||||||||||
Other debt |
2,906 | 2,009 | 2,147 | 1,916 | 1,313 | 537 | |||||||||||||
| | | | | | | | | | | | | | | | | | | | |
Total |
$ | 4,846 | $ | 148,785 | $ | 4,050 | $ | 303,564 | $ | 53,051 | $ | 56,374 | |||||||
| | | | | | | | | | | | | | | | | | | | |
| | | | | | | | | | | | | | | | | | | | |
| | | | | | | | | | | | | | | | | | | | |
(10) Derivative Transactions
The Company had no commodity future contracts or forward exchange contracts outstanding during 2014. The Company marks -to -market its open futures positions and forward exchange contracts at the end of each period and records the net unrealized gain or loss during the period in derivative (gains) losses in the consolidated statements of operations or in accumulated other comprehensive income (loss) in the consolidated balance sheets in accordance with the applicable accounting guidance. In the years ended December 31, 2012, and 2013, the Company recorded unrealized gains of $2,151, and $108, respectively, in other comprehensive income (loss) related to its futures contracts. Of the Company's net futures contracts liability of $107 at December 31, 2012, $5 was recorded as an asset in prepaid expenses and other current assets and $112 was recorded as an
91
CLEAN ENERGY FUELS CORP. AND SUBSIDIARIES
NOTES TO CONSOLIDATED FINANCIAL STATEMENTS (Continued)
(In thousands, except share and per share data)
(10) Derivative Transactions (Continued)
accrued liability in the Company's consolidated balance sheet at December 31, 2012. The Company's ineffectiveness related to its futures contracts in the years ended December 31, 2012 and 2013 was insignificant. The Company's ineffectiveness related to its forward exchange contracts for the year ended December 31, 2013 was insignificant, and there were no forward contracts in place during 2012. During the years ended December 31, 2012 and 2013, the Company recognized a loss of $2,370 and $65, respectively, in cost of sales in the accompanying consolidated statements of operations related to its futures contracts that were settled during the respective years. These amounts were reclassified from accumulated other comprehensive income (loss).
(11) Stockholders' Equity
Authorized Shares
The Company's certificate of incorporation authorizes the issuance of two classes of capital stock designated as common stock and preferred stock, each having $0.0001 par value per share. As of December 31, 2014, the Company was authorized to issue 225,000,000 shares, of which 224,000,000 shares are designated common stock and 1,000,000 shares are designated preferred stock.
Dividend Provisions
The Company did not declare nor pay any dividends during the years ended December 31, 2012, 2013 or 2014.
Voting Rights
Each holder of common stock has the right to one vote per share owned on matters presented for stockholder action.
Issuance of Common Stock and Warrants
On October 28, 2008, the Company entered into a Placement Agent Agreement (the "Placement Agent Agreement") relating to the sale and issuance by the Company to select investors of 4,419,192 units (the "Units"), with each Unit consisting of (i) one share of the Company's common stock, (ii) a warrant to purchase up to 0.75 shares of the Company's common stock (the "Series I Warrant"), and (iii) one warrant to purchase up to 0.2571 shares of the Company's common stock (the "Series II Warrant"). The price of each Unit was $7.92 per Unit. The transaction closed on November 3, 2008, and the Company issued 4,419,192 shares of common stock, Series I Warrants to purchase up to 3,314,394 shares of common stock, and Series II Warrants to purchase up to 1,136,364 shares of common stock. The Company received approximately $32,484 after deducting the placement agent's fees and other offering expenses related to the Unit sale. The proceeds of $32,484 were allocated between the common stock, the Series I Warrants and the Series II Warrants. The Company allocated $19,166, $9,745 and $3,573 to the common stock, the Series I Warrants and the Series II Warrants, respectively.
The Series I Warrants became exercisable beginning six months from the date of issuance, have a term of seven years from the date they became exercisable, and carry an exercise price of $12.68 per share. On November 10, 2010, the Company entered into an amendment with one of the holders of the
92
CLEAN ENERGY FUELS CORP. AND SUBSIDIARIES
NOTES TO CONSOLIDATED FINANCIAL STATEMENTS (Continued)
(In thousands, except share and per share data)
(11) Stockholders' Equity (Continued)
Series I Warrants pursuant to which the expiration date of such warrant for the purchase of 1,183,712 shares of common stock was changed to November 10, 2010. In consideration of the modification to the expiration date, the Company agreed to pay the holder of such warrant approximately $3,172. The Company received notice on November 10, 2010 that such warrant was being exercised in full, and issued 1,183,712 shares of its common stock for an aggregate exercise price of approximately $15,009. Upon exercise, the Company recognized a gain of approximately $3,208 related to the transaction. For additional information on the Series I Warrants, see note 18.
The Series II Warrants became exercisable on November 5, 2008 upon the failure of the California Alternative Fuel Vehicles and Renewable Energy Act, or Proposition 10, in the California statewide election. The Series II Warrants were all exercised on a cashless basis at the exercise price of $0.01 per share, which resulted in the issuance of 1,134,759 shares of common stock to the Series II Warrant holders on November 12, 2008.
Concurrently with the execution of the Credit Agreement on November 7, 2012, the Company issued to GE a warrant (the "GE Warrant"), which entitles GE to purchase up to an aggregate of five million shares of the Company's common stock at a price per share of $0.01. The shares subject to the GE Warrant, as it was originally issued, were to become exercisable pursuant to the following schedule: (i) 500,000 shares were immediately exercisable (the "Commitment Fee Shares"), (ii) an additional 1,250,000 shares were to become exercisable at the time that the first Tranche A Loan is made under the Credit Agreement, (iii) an additional 1,250,000 shares were to become exercisable at the time that the first Tranche B Loan is made under the Credit Agreement, (iv) an additional 1,000,000 shares were to become exercisable at the time that Tranche A Loans in aggregate principal amount of at least $15,000 have been made under the Credit Agreement, and (v) the remaining 1,000,000 shares were to become exercisable at the time that Tranche B Loans in aggregate principal amount of at least $15,000 have been made under the Credit Agreement; provided, however, that if no Loans were made as contemplated by (ii) through (v) above pursuant to the Credit Agreement, an additional 500,000 shares (the "Termination Shares") were to become exercisable. On December 29, 2014, the Company and GE amended the GE Warrant to provide that the shares subject to the GE Warrant become exercisable pursuant to the following schedule: (i) the Commitment Fee Shares continue to be fully exercisable, (ii) the Termination Shares became exercisable on December 31, 2014, (iii) an additional 1,250,000 shares become exercisable at the time that the first Tranche A Loan is made under the Credit Agreement, (iv) an additional 1,250,000 shares become exercisable at the time that the first Tranche B Loan is made under the Credit Agreement, (v) an additional 750,000 shares become exercisable at the time that Tranche A Loans in aggregate principal amount of at least $15,000 have been made under the Credit Agreement, and (vi) the remaining 750,000 shares become exercisable at the time that Tranche B Loans in aggregate principal amount of at least $15,000 have been made under the Credit Agreement.
The GE Warrant terminates on November 7, 2022. During the exercise period, if the Company issues or sells any shares of its common stock other than exempted securities (as defined in the GE Warrant) for a price per share less than a price equal to 80% of the market price on the day of such issue or sale, then, immediately after such issuance and sale, the number of shares then purchasable shall be increased on a proportionate basis by a formula set forth in the GE Warrant. All of the shares issuable upon exercise of the GE Warrant have been registered for resale by the holder thereof
93
CLEAN ENERGY FUELS CORP. AND SUBSIDIARIES
NOTES TO CONSOLIDATED FINANCIAL STATEMENTS (Continued)
(In thousands, except share and per share data)
(11) Stockholders' Equity (Continued)
pursuant to a registration statement filed with and declared effective by the Securities and Exchange Commission.
The Company measured the fair value of the 5,000,000 shares underlying the GE Warrant at $56,158 and recorded the amount in additional paid-in-capital and other long-term assets as a deferred financing cost. The fair value of the 500,000 shares that were immediately exercisable and the 500,000 shares that became exercisable on December 31, 2014 are being amortized over the estimated term of the Credit Agreement on the straight-line basis. The fair value of the remaining 4,000,000 shares will be allocated proportionately to the draws of the related Loans as they become exercisable and amortized over the estimated term of the draws using the effective interest method. The issuance of the GE Warrant is not included in the consolidated statements of cash flows as it is a non-cash financing activity.
Conversion of Convertible Debt into Common Stock
In April 2012, $1,003 of principal and accrued interest under a SLG Note was converted by the holder thereof into 66,888 shares of the Company's common stock.
In January and February 2013, $4,030 of principal and accrued interest under an SLG Note was converted by the holder thereof into 268,664 shares of the Company's common stock.
Stock-Based Compensation
The following table summarizes the compensation expense and related income tax benefit related to the stock-based compensation expense recognized during the years ended December 31, 2012, 2013 and 2014:
|
|
Years Ended December 31, | |||||||||
|---|---|---|---|---|---|---|---|---|---|---|
|
|
2012 | 2013 | 2014 | |||||||
Stock-based compensation expense |
$ | 22,087 | $ | 23,008 | $ | 11,514 | ||||
| | | | | | | | | | | |
Stock-based compensation expense, net of tax |
$ | 22,087 | $ | 23,008 | $ | 11,514 | ||||
| | | | | | | | | | | |
| | | | | | | | | | | |
| | | | | | | | | | | |
Stock Option Plans
In December 2002, the Company adopted its 2002 Stock Option Plan ("2002 Plan"). When the 2002 Plan was available for the issuance of new awards, the Company's board of directors determined eligibility, vesting schedules, and exercise prices for options granted thereunder. Options generally have a term of ten years.
Under the 2002 Plan, eligible persons could be issued options for services rendered to the Company. Under the 2002 Plan, the purchase price per share for each option granted could not be less than 100% of the fair market value of the Company's common stock on the date of such option grant; provided, however, that the purchase price per share of common stock issued to a 10% stockholder could not be less than 110% of the fair market value of the Company's common stock on the date of such option grant. Options generally vest over a three-year period.
94
CLEAN ENERGY FUELS CORP. AND SUBSIDIARIES
NOTES TO CONSOLIDATED FINANCIAL STATEMENTS (Continued)
(In thousands, except share and per share data)
(11) Stockholders' Equity (Continued)
In December 2006, the Company adopted its 2006 Equity Incentive Plan ("2006 Plan"). The 2006 Plan was effective on May 24, 2007, the date the Company completed its initial public offering of common stock. The 2002 Plan became unavailable for new awards upon the effectiveness of the 2006 Plan. If any outstanding option under the 2002 Plan expires or is cancelled, the shares allocable to the unexercised portion of that option will be added to the share reserve under the 2006 Plan and will be available for grant under the 2006 Plan. As of December 31, 2014, the Company had 18,890,500 shares reserved for issuance under its option plans. At December 31, 2014, the Company had 779,127 shares available for future grant under the 2006 Plan.
Stock Options
The following table summarizes stock option activity during the year ended December 31, 2014:
|
|
Number of Shares |
Weighted Average Exercise Price |
Weighted Average Remaining Contractual Term (in years) |
Aggregate Intrinsic Value |
|||||||||
|---|---|---|---|---|---|---|---|---|---|---|---|---|---|
Outstanding, December 31, 2013 |
11,526,998 | $ | 11.79 | ||||||||||
Options granted |
957,000 | 10.23 | |||||||||||
Options exercised |
(468,279 | ) | 3.78 | ||||||||||
Options forfeited |
(529,418 | ) | 13.40 | ||||||||||
| | | | | | | | | | | | | | |
Outstanding, December 31, 2014 |
11,486,301 | 11.91 | 5.04 | | |||||||||
| | | | | | | | | | | | | | |
| | | | | | | | | | | | | | |
| | | | | | | | | | | | | | |
Exercisable, December 31, 2014 |
9,875,201 | 11.94 | 4.46 | | |||||||||
| | | | | | | | | | | | | | |
| | | | | | | | | | | | | | |
| | | | | | | | | | | | | | |
As of December 31, 2014, there was $6,967 of total unrecognized compensation cost related to non-vested shares underlying outstanding stock options. That cost is expected to be recognized over a weighted average period of 1.5 years. The total fair value of shares vested during the year ended December 31, 2014 was $8,101.
The Company is obligated to issue new shares of its common stock upon exercise of outstanding stock options. The intrinsic value of all stock options exercised during 2012, 2013 and 2014 was $18,822, $935, and $2,568, respectively.
The fair value of each stock option granted during the year ended December 31, 2014 was estimated as of the date of grant using the Black-Scholes option pricing model and using the following assumptions:
Dividend yield |
0.00% | |
Expected volatility |
52.3% to 67.0% | |
Risk-free interest rate |
1.1% to 1.8% | |
Expected life in years |
6.0 |
The weighted-average grant date fair value of options granted during the years ended December 31, 2012, 2013, and 2014, was $7.95, $6.86, and $5.32, respectively. The volatility amounts used during the periods were estimated based on the Company's historical volatility and the Company's
95
CLEAN ENERGY FUELS CORP. AND SUBSIDIARIES
NOTES TO CONSOLIDATED FINANCIAL STATEMENTS (Continued)
(In thousands, except share and per share data)
(11) Stockholders' Equity (Continued)
implied volatility of its traded options. The expected lives used during the periods were based on historical exercise periods and the Company's anticipated exercise periods for its outstanding stock options. The risk free rates used during the periods were based on the U.S. Treasury yield curve for the expected life of the stock options at the time of grant. The Company recorded $14,199, $13,751, and $7,286 of stock option expense during the years ended December 31, 2012, 2013 and 2014, respectively. The Company has not recorded any tax benefit related to its stock option expense.
Market-Based Restricted Stock Units
The Company issued 2,034,500 market-based restricted stock units ("Market-Based RSUs") to certain key employees during 2012 and 2014. A holder of Market-Based RSUs will receive one share of the Company's common stock for each Market-Based RSU held if (x) between two years and four years from the date of grant of the Market-Based RSU, the closing price of the Company's common stock equals or exceeds, for twenty consecutive trading days, 135% of the closing price of the Company's common stock on the Market-Based RSU grant date (the "Stock Price Condition") and (y) the holder is employed by the Company at the time the Stock Price Condition is satisfied. If the Stock Price Condition is not satisfied prior to four years from the date of grant, the Market-Based RSUs will be automatically forfeited. The Market-Based RSUs are subject to the terms and conditions of the Company's 2006 Plan and a Notice of Grant of Restricted Stock Unit and Restricted Stock Unit Agreement.
The following table summarizes the Company's Market-Based RSU activity during the year ended December 31, 2014:
|
|
Number of ares |
Weighted Average Fair Value at Grant Date |
Weighted Average Remaining Contractual Term (in years) |
|||||||
|---|---|---|---|---|---|---|---|---|---|---|
Outstanding, December 31, 2013 |
1,545,000 | $ | 11.42 | |||||||
RSUs granted |
489,500 | 8.26 | ||||||||
RSUs vested |
| |||||||||
RSUs forfeited |
(265,500 | ) | 10.62 | |||||||
| | | | | | | | | | | |
Outstanding and non-vested, December 31, 2014 |
1,769,000 | $ | 10.67 | 1.57 | ||||||
| | | | | | | | | | | |
| | | | | | | | | | | |
| | | | | | | | | | | |
As of December 31, 2014, there was $2,191 of total unrecognized compensation cost related to non-vested shares underlying outstanding Market-Based RSUs. That cost is expected to be recognized over a weighted average period of 1.1 years.
The Company recorded $8,821 and $2,556 of expense in 2013 and 2014, respectively, related to the Market-Based RSUs. The Company has not recorded any tax benefit related to its Market-Based RSU expense.
96
CLEAN ENERGY FUELS CORP. AND SUBSIDIARIES
NOTES TO CONSOLIDATED FINANCIAL STATEMENTS (Continued)
(In thousands, except share and per share data)
(11) Stockholders' Equity (Continued)
The fair value of the Market-Based RSUs granted during the year ended December 31, 2014 was estimated on the date of grant using the Monte Carlo method and using the following assumptions:
|
|
February 2, 2014 | |||
|---|---|---|---|---|
Dividend yield |
0.00 | % | ||
Expected volatility |
47.0 | % | ||
Risk-free interest rate |
1.1 | % | ||
Expected life in years |
2.0 | |||
Service-Based Restricted Stock Units
The Company has issued service-based restricted stock units ("Service-Based RSUs") to key employees that vest annually over the three years following the date of issuance at a rate of 34%, 33% and 33%, respectively, if the holder is in service to the Company at each vesting date. The Service-Based RSUs are subject to the terms and conditions of the Company's 2006 Plan and a Notice of Grant of Restricted Stock Unit and Restricted Stock Unit Agreement.
The following table summarizes the Company's Service-Based RSU activity during the year ended December 31, 2014:
|
|
Number of Shares |
Weighted Average Fair Value at Grant Date |
Weighted Average Remaining Contractual Term (in years) |
|||||||
|---|---|---|---|---|---|---|---|---|---|---|
Nonvested at December 31, 2013 |
45,836 | $ | 13.09 | |||||||
RSUs granted |
792,500 | 5.54 | ||||||||
RSUs vested |
(15,584 | ) | 13.09 | |||||||
RSUs forfeited |
| |||||||||
| | | | | | | | | | | |
Outstanding and non-vested at December 31, 2014 |
822,752 | $ | 5.82 | 2.85 | ||||||
| | | | | | | | | | | |
| | | | | | | | | | | |
| | | | | | | | | | | |
As of December 31, 2014, there was $4,186 of total unrecognized compensation cost related to non-vested shares underlying outstanding Service-Based RSUs. That cost is expected to be recognized evenly over a period of 2.8 years.
The Company recorded $51 and $365 of expense in 2013 and 2014, respectively, related to the Service-Based RSUs. The Company has not recorded any tax benefit related to its Service-Based RSU expense.
The fair value of each Service-Based RSU granted in during the year ended December 31, 2014 was estimated using the closing stock price of the Company's common stock on the date of grant.
Employee Stock Purchase Plan
On May 7, 2013, the Company adopted an employee stock purchase plan (the "ESPP"), pursuant to which eligible employees may purchase shares of the Company's common stock at 85% of the fair
97
CLEAN ENERGY FUELS CORP. AND SUBSIDIARIES
NOTES TO CONSOLIDATED FINANCIAL STATEMENTS (Continued)
(In thousands, except share and per share data)
(11) Stockholders' Equity (Continued)
market value of the common stock on the last trading day of two consecutive, non-concurrent offering periods each year. The Company has reserved 2,500,000 shares of its common stock for issuance under the ESPP, and the first offering period under the ESPP commenced on September 1, 2013.
The Company recorded $29 and $67 of expense related to the ESPP during 2013 and 2014, respectively. The Company has not recorded any tax benefits related to its ESPP expense. At December 31, 2014, the Company had sold an aggregate of 57,881 shares pursuant to the ESPP.
Non-Qualified Non-Public Subsidiary Unit Options
In September 2013, the Company's wholly owned subsidiary Clean Energy Renewable Fuels, LLC ("CERF") adopted the Clean Energy Renewable Fuels, LLC 2013 Unit Option Plan (the "CERF Plan"). 150,000 Class B units representing membership interests in CERF were initially reserved for issuance under the CERF Plan.
The following table summarizes CERF's unit option activity during the year ended December 31, 2014:
|
|
Number of Units |
Weighted Average Exercise Price |
Weighted Average Remaining Contractual Term (in years) |
Aggregate Intrinsic Value |
|||||||||
|---|---|---|---|---|---|---|---|---|---|---|---|---|---|
Outstanding, December 31, 2013 |
115,000 | $ | 40.80 | ||||||||||
Options granted |
| | | | |||||||||
| | | | | | | | | | | | | | |
Outstanding and non-vested, December 31, 2014 |
115,000 | $ | 40.80 | 8.72 | $ | | |||||||
| | | | | | | | | | | | | | |
| | | | | | | | | | | | | | |
| | | | | | | | | | | | | | |
As of December 31, 2014, there was $2,070 of total unrecognized compensation cost related to non-vested units underlying outstanding unit options. That cost is expected to be recognized over a weighted average period of 1.8 years.
The fair value of each unit option is estimated as of the date of grant using the Black-Scholes option pricing model and using the following assumptions:
Dividend yield |
0.00 | % | ||
Expected volatility |
96.4 | % | ||
Risk-free interest rate |
1.9 | % | ||
Expected life in years |
6.0 |
The grant date fair value of options granted in September 2013 was $31.65, which was determined contemporaneously with the grants. The volatility amounts used during the period were estimated based on the historical volatility of a certain peer group of CERF for a period commensurate with the expected life of the unit options granted. The expected life used was CERF's anticipated exercise periods for its outstanding unit options. The risk free rate was based on the U.S. Treasury yield curve for the expected life of the unit options at the time of grant. CERF recorded $356 and $1,240 of unit option expense during 2013 and 2014, respectively. CERF has not recorded any tax benefit related to its unit option expense.
98
CLEAN ENERGY FUELS CORP. AND SUBSIDIARIES
NOTES TO CONSOLIDATED FINANCIAL STATEMENTS (Continued)
(In thousands, except share and per share data)
(12) Income Taxes
The components of loss before income taxes for the years ended December 31, 2012, 2013, and 2014 are as follows:
|
|
2012 | 2013 | 2014 | |||||||
|---|---|---|---|---|---|---|---|---|---|---|
U.S. |
$ | (91,608 | ) | $ | (40,195 | ) | $ | (64,913 | ) | |
Foreign |
(7,960 | ) | (23,009 | ) | (24,871 | ) | ||||
| | | | | | | | | | | |
|
$ | (99,568 | ) | $ | (63,204 | ) | $ | (89,784 | ) | |
| | | | | | | | | | | |
| | | | | | | | | | | |
| | | | | | | | | | | |
The provision (benefit) for income taxes consists of the following:
|
|
2012 | 2013 | 2014 | |||||||
|---|---|---|---|---|---|---|---|---|---|---|
Current: |
||||||||||
Federal |
$ | 269 | $ | 87 | $ | 190 | ||||
State |
302 | 310 | 238 | |||||||
Foreign |
(61 | ) | 2,910 | 1,017 | ||||||
| | | | | | | | | | | |
Total current |
510 | 3,307 | 1,445 | |||||||
Deferred: |
||||||||||
Federal |
| 134 | 29 | |||||||
State |
| 47 | (10 | ) | ||||||
Foreign |
784 | 227 | (389 | ) | ||||||
| | | | | | | | | | | |
Total deferred |
784 | 408 | (370 | ) | ||||||
| | | | | | | | | | | |
Total |
$ | 1,294 | $ | 3,715 | $ | 1,075 | ||||
| | | | | | | | | | | |
| | | | | | | | | | | |
| | | | | | | | | | | |
Income tax expense (benefit) for the years ended December 31, 2012, 2013 and 2014 differs from the "expected" amount computed using the federal income tax rate of 35% as a result of the following:
|
|
2012 | 2013 | 2014 | |||||||
|---|---|---|---|---|---|---|---|---|---|---|
Computed expected tax expense (benefit) |
$ | (34,849 | ) | $ | (22,121 | ) | $ | (30,415 | ) | |
Nondeductible expenses |
5,194 | 7,216 | 10,690 | |||||||
Tax rate differential on foreign earnings |
(717 | ) | 2,993 | 5,733 | ||||||
Basis difference on sale |
| (6,457 | ) | | ||||||
Tax credits |
| (35,604 | ) | (8,286 | ) | |||||
Other |
(1,442 | ) | 82 | (1,121 | ) | |||||
Change in valuation allowance |
33,108 | 57,606 | 24,474 | |||||||
| | | | | | | | | | | |
Total tax expense (benefit) |
$ | 1,294 | $ | 3,715 | $ | 1,075 | ||||
| | | | | | | | | | | |
| | | | | | | | | | | |
| | | | | | | | | | | |
During the fourth quarter of 2014, federal tax legislation extended the VETC through December 31, 2014 with retroactive effect to the beginning of 2014. In addition, during the first quarter of 2013, federal tax legislation extended the VETC through December 31, 2013 with retroactive effect to the beginning of 2012. Federal tax guidance was issued in 2013 that clarified that the VETC in excess of the Company's fuel tax obligation, which is collected from customers, can be excluded from taxable income. The Company recorded a federal tax benefit of $8,221 and $7,068 related to the
99
CLEAN ENERGY FUELS CORP. AND SUBSIDIARIES
NOTES TO CONSOLIDATED FINANCIAL STATEMENTS (Continued)
(In thousands, except share and per share data)
(12) Income Taxes (Continued)
exclusion of VETC associated with 2014 and 2013 fuel sales in excess of its fuel tax obligation and a federal tax benefit of $27,497 was recorded in 2013 related to the exclusion of similar VETC amounts associated with fuel sales from 2006 through 2012. These amounts increased the Company's deferred tax asset attributed to its federal net operating loss carryforwards and the Company's deferred tax asset valuation allowance.
Deferred tax assets and liabilities result from differences between the financial statement carrying amounts and the tax bases of existing assets and liabilities. The tax effect of temporary differences that give rise to deferred tax assets and liabilities as of December 31, 2013 and 2014 are as follows:
|
|
2013 | 2014 | |||||
|---|---|---|---|---|---|---|---|
Deferred tax assets: |
|||||||
Accrued expenses |
$ | 3,367 | $ | 4,834 | |||
Sales-type leases |
997 | 908 | |||||
Alternative minimum tax and general business credits |
4,903 | 4,966 | |||||
Derivative loss |
1,161 | 527 | |||||
Stock option expense |
20,832 | 21,741 | |||||
Other |
4,693 | 2,596 | |||||
Loss carryforwards |
126,563 | 147,706 | |||||
| | | | | | | | |
Total deferred tax assets |
162,516 | 183,278 | |||||
Less valuation allowance |
(136,969 | ) | (160,436 | ) | |||
| | | | | | | | |
Net deferred tax assets |
25,547 | 22,842 | |||||
| | | | | | | | |
Deferred tax liabilities: |
|||||||
Depreciation and amortization |
(21,800 | ) | (20,028 | ) | |||
Goodwill |
(1,626 | ) | (3,864 | ) | |||
Partnership income |
(3,540 | ) | | ||||
| | | | | | | | |
Total deferred tax liabilities |
(26,966 | ) | (23,892 | ) | |||
| | | | | | | | |
Net deferred tax liabilities |
$ | (1,419 | ) | $ | (1,050 | ) | |
| | | | | | | | |
| | | | | | | | |
| | | | | | | | |
At December 31, 2014, the Company had federal, state and foreign net operating loss carryforwards of approximately $369,332, $284,828 and $50,334, respectively. The Company's federal, state and foreign net operating loss carryforwards will, if not utilized, expire beginning in 2026, 2015 and 2028, respectively. The Company also has federal tax credit carryforwards of $4,750 that will expire beginning in 2026. Due to the change of ownership provisions of Internal Revenue Code Section 382, utilization of a portion of the Company's net operating loss and tax credit carryforwards may be limited in future periods.
In assessing the realizability of the net deferred tax assets, management considers whether it is more likely than not that some or all of the deferred tax assets will not be realized. The ultimate realization of deferred tax assets is dependent upon the generation of future taxable income during the periods in which those temporary differences become deductible. Management considers projected future taxable income and tax planning strategies in making this assessment. As of December 31, 2013 and 2014, the Company provided a valuation allowance of $136,969, and $160,436, respectively, to
100
CLEAN ENERGY FUELS CORP. AND SUBSIDIARIES
NOTES TO CONSOLIDATED FINANCIAL STATEMENTS (Continued)
(In thousands, except share and per share data)
(12) Income Taxes (Continued)
reduce the net deferred tax assets due to uncertainty surrounding the realizability of these assets. The net increase in the valuation allowance for the years ended December 31, 2013, and 2014 was $55,711, and $23,468, respectfully. The changes in the valuation allowance were primarily attributable to operating losses incurred in certain jurisdictions for which a full valuation allowance was established.
As of December 31, 2014, the Company has not provided deferred U.S. income taxes or foreign withholding taxes on temporary differences of approximately $3,327 resulting from earnings of certain non-U.S. subsidiaries which are permanently reinvested outside the U.S. Unrecognized deferred taxes on remittance of these funds are not expected to be material.
The Company does not recognize the impact of a tax position in its financial statements unless the position is more likely than not to be sustained, based on the technical merits of the position. The unrecognized tax benefits of $21,974 at December 31, 2014 included $692 of tax benefits that, if recognized, would reduce the Company's annual effective tax rate. The remaining $21,282, if recognized, would not result in a tax benefit since it would be fully offset with a valuation allowance.
The following is a tabular reconciliation of the total amounts of unrecognized tax benefits for the years ended December 31, 2012, 2013 and 2014:
Unrecognized tax benefitDecember 31, 2012 |
$ | 515 | ||
Gross increasestax positions in current year |
16,685 | |||
Gross increasestax positions in prior years |
198 | |||
| | | | | |
Unrecognized tax benefitDecember 31, 2013 |
17,398 | |||
Gross increasestax positions in current year |
4,722 | |||
Gross increasestax positions in prior years |
(146 | ) | ||
| | | | | |
Unrecognized tax benefitDecember 31, 2014 |
$ | 21,974 | ||
| | | | | |
| | | | | |
| | | | | |
The increase in the Company's unrecognized tax benefits during 2013 and 2014 is primarily attributable to the portion of VETC offset by the fuel tax the Company collected from its customers as an unrecognized tax benefit during 2013 and 2014. The Company believes the portion of VETC that is offset by the fuel tax the Company collects from its customers can be excluded from taxable income, although the ultimate outcome of this tax position is uncertain. The Company's changes in its unrecognized tax benefits related to prior years were attributable to transfer pricing on the sale of goods and services.
FASB authoritative guidance requires the Company to accrue interest and penalties where there is an underpayment of taxes based on the Company's best estimate of the amount ultimately to be paid. The Company's policy is to recognize interest accrued related to unrecognized tax benefits and penalties as income tax expense. During each of the years ended December 31, 2012, 2013 and 2014, the Company accrued interest of $21, $75, and, $120, respectively.
The Company is subject to taxation in the United States and various states and foreign jurisdictions. The Company's tax years for 2010 through 2014 are subject to examination by various tax authorities. The Company is no longer subject to U.S. examination for years before 2011, and state examinations for years before 2010.
101
CLEAN ENERGY FUELS CORP. AND SUBSIDIARIES
NOTES TO CONSOLIDATED FINANCIAL STATEMENTS (Continued)
(In thousands, except share and per share data)
(12) Income Taxes (Continued)
A number of years may elapse before an uncertain tax position is finally resolved. It is often difficult to predict the final outcome or the timing of resolution of any particular uncertain tax position, but the Company believes that its reserves for income taxes reflect the most probable outcomes. The Company adjusts the reserve, as well as the related interest and penalties, in light of changing facts and circumstances. The amount of penalties accrued is immaterial. Settlement of any particular position would usually require the use of cash and result in the reduction of the related reserve, or there could be a change in the amount of the Company's net operating loss. The resolution of a matter would be recognized as an adjustment to the provision for income taxes at the effective tax rate in the period of resolution. The Company does not expect a significant increase or decrease in its uncertain tax positions within the next twelve months.
(13) Commitments and Contingencies
Environmental Matters
The Company is subject to federal, state, local, and foreign environmental laws and regulations. The Company does not anticipate any expenditures to comply with such laws and regulations which would have a material impact on the Company's consolidated financial position, results of operations, or liquidity. The Company believes that its operations comply, in all material respects, with applicable federal, state, local and foreign environmental laws and regulations.
Litigation, Claims and Contingencies
The Company may become party to various legal actions that arise in the ordinary course of its business. During the course of its operations, the Company is also subject to audit by tax authorities for varying periods in various federal, state, local and foreign tax jurisdictions. Disputes may arise during the course of such audits as to facts and matters of law. It is impossible to determine the ultimate liabilities that the Company may incur resulting from any such lawsuits, claims and proceedings, audits, commitments, contingencies and related matters or the timing of these liabilities, if any. If these matters were to ultimately be resolved unfavorably, an outcome not currently anticipated, it is possible that such outcome could have a material adverse effect upon the Company's consolidated financial position, results of operations, or liquidity. However, the Company believes that the ultimate resolution of such matters will not have a material adverse effect on the Company's consolidated financial position, results of operations, or liquidity.
Operating Lease Commitments
The Company leases facilities, including the land for its LNG production plant in Boron, California, and certain equipment under noncancelable operating leases expiring at various dates
102
CLEAN ENERGY FUELS CORP. AND SUBSIDIARIES
NOTES TO CONSOLIDATED FINANCIAL STATEMENTS (Continued)
(In thousands, except share and per share data)
(13) Commitments and Contingencies (Continued)
through 2038. The following schedule represents the future minimum lease obligations for all noncancelable operating leases as of December 31, 2014:
Fiscal year: |
||||
2015 |
$ | 10,343 | ||
2016 |
9,124 | |||
2017 |
7,492 | |||
2018 |
5,348 | |||
2019 |
5,153 | |||
Thereafter |
21,958 | |||
| | | | | |
Total future minimum lease payments |
$ | 59,418 | ||
| | | | | |
| | | | | |
| | | | | |
Rent expense, including variable rent, totaled $7,737, $10,504, and $10,140 for the years ended December 31, 2012, 2013 and 2014, respectively.
Long-Term Take-or-Pay Natural Gas Supply Contracts
In October 2007, the Company entered into an LNG supply contract with Desert Gas Services (formerly known as Spectrum Energy Services, LLC) ("DGS") to purchase, on a take-or-pay basis over a term of ten years, 45,000 gallons per day, which was increased to 65,000 gallons per day in March 2014, of LNG from a plant constructed by DGS in Ehrenberg, Arizona, which is near the California border. This obligation began in March 2010, and for the years ended December 31, 2012, 2013 and 2014, the Company paid approximately $8,153, $11,404, and $14,267 respectively, under the take-or-pay supply contract. The contract expires in October 2017. At December 31, 2014, the fixed commitments under this contract totaled approximately $7,974, $4,628, and 3,857 for the years ending December 31, 2015 through December 31, 2017.
(14) Geographic Information
Several of the Company's functions, including marketing, engineering, and finance are performed at the corporate level. As a result, significant interdependence and overlap exists among the Company's geographic areas. Accordingly, revenue, operating income (loss), and long-lived assets shown for each geographic area may not be the amounts which would have been reported if the geographic areas were independent of one another. Revenue by geographic area is based on where services are rendered and
103
CLEAN ENERGY FUELS CORP. AND SUBSIDIARIES
NOTES TO CONSOLIDATED FINANCIAL STATEMENTS (Continued)
(In thousands, except share and per share data)
(14) Geographic Information (Continued)
finished goods are sold. Operation income (loss) is based on the location of the entity selling the finished goods or providing the services.
|
|
2012 | 2013 | 2014 | |||||||
|---|---|---|---|---|---|---|---|---|---|---|
Revenue: |
||||||||||
United States |
$ | 286,125 | $ | 292,250 | $ | 360,881 | ||||
Canada |
8,364 | 13,922 | 16,241 | |||||||
Other |
39,519 | 46,303 | 51,818 | |||||||
| | | | | | | | | | | |
Total revenue |
$ | 334,008 | $ | 352,475 | $ | 428,940 | ||||
| | | | | | | | | | | |
| | | | | | | | | | | |
| | | | | | | | | | | |
Operating income (loss): |
||||||||||
United States |
$ | (69,030 | ) | $ | (44,797 | ) | $ | (41,543 | ) | |
Canada |
(188 | ) | (1,594 | ) | (3,087 | ) | ||||
Other |
(1,304 | ) | (5,300 | ) | (9,734 | ) | ||||
| | | | | | | | | | | |
Total operating income (loss) |
$ | (70,522 | ) | $ | (51,691 | ) | $ | (54,364 | ) | |
| | | | | | | | | | | |
| | | | | | | | | | | |
| | | | | | | | | | | |
Long-lived assets: |
||||||||||
United States |
$ | 480,067 | $ | 544,638 | $ | 582,028 | ||||
Canada |
122,291 | 103,997 | 85,984 | |||||||
Other |
3,547 | 7,537 | 6,854 | |||||||
| | | | | | | | | | | |
Total long-lived assets |
$ | 605,905 | $ | 656,172 | $ | 674,866 | ||||
| | | | | | | | | | | |
| | | | | | | | | | | |
| | | | | | | | | | | |
The Company's goodwill and intangible assets at December 31, 2012, 2013 and 2014 relate to its United States operations and its BAF (through June 28, 2013, see note 2), IMW, Northstar, and NG Advantage (beginning on October 14, 2014, see note 2) operations.
(15) 401(k) Plan
The Company has established a savings plan ("Savings Plan") which is qualified under Section 401(k) of the Internal Revenue Code. Eligible employees may elect to make contributions to the Savings Plan through salary deferrals of up to 90% of their base pay, subject to Internal Revenue Code limitations. The Company may make discretionary contributions to the Savings Plans that are subject to limitations. For the years ended December 31, 2012, 2013, and 2014 the Company contributed approximately $1,289, $1,448, and $1,040 of matching contributions to the Savings Plan, respectively.
(16) Supplier Concentrations
During 2012, 2013, and 2014, the Company incurred approximately 8%, 3%, and 4% respectively, of its natural gas expense related to its LNG sales from Williams Gas Processing Company pursuant to a floating rate purchase contract that includes minimum purchase commitments. During 2012, 2013, and 2014, the Company incurred approximately 31%, 22%, and 17% respectively, of its natural gas expense related to its LNG sales from Shell Energy, which supplies the Company's LNG plant in California (through April of 2013) and DGS's plant in Arizona, where the Company has a take or pay obligation. During 2012, 2013 and 2014, the Company incurred approximately 16%, 7%, and 3%,
104
CLEAN ENERGY FUELS CORP. AND SUBSIDIARIES
NOTES TO CONSOLIDATED FINANCIAL STATEMENTS (Continued)
(In thousands, except share and per share data)
(16) Supplier Concentrations (Continued)
respectively, of its natural gas costs related to its CNG operations from the SoCal Gas Company (through May of 2013) and San Diego Gas and Electric. During the second quarter of 2013, the Company switched from Shell Energy and SoCal Gas Company to BP Energy for its natural gas supply to its LNG plant in California and to its CNG operations in California. The Company incurred approximately 24% of its natural gas expense related to its LNG and CNG sales from BP Energy during 2014. Any inability to obtain natural gas in the amounts needed on a timely basis or at commercially reasonable prices could result in interruption of gas deliveries or increases in gas costs, which could have a material adverse effect on the Company's business, financial condition, and results of operations until alternative sources could be identified and established at a reasonable cost.
(17) Capitalized Lease Obligation and Receivables
The Company leases equipment under capital leases with a weighted-average interest rate of 15.02%. At December 31, 2014, future payments under these capital leases are as follows:
2015 |
$ | 1,006 | ||
2016 |
644 | |||
2017 |
686 | |||
2018 |
365 | |||
2019 |
357 | |||
Thereafter |
938 | |||
| | | | | |
Total minimum lease payments |
3,996 | |||
Less amount representing interest |
(1,304 | ) | ||
| | | | | |
Present value of future minimum lease payments |
2,692 | |||
Less current portion |
(700 | ) | ||
| | | | | |
Capital lease obligations, less current portion |
$ | 1,992 | ||
| | | | | |
| | | | | |
| | | | | |
The value of the equipment under capital lease as of December 31, 2013 and 2014 was $6,802 and $4,898, with related accumulated amortization of $4,185 and $1,936, respectively.
The Company also leases certain fueling station equipment to certain customers under sales-type leases at a weighted average effective interest rate of 4.37%. The leases are payable in varying monthly installments through February 2018.
105
CLEAN ENERGY FUELS CORP. AND SUBSIDIARIES
NOTES TO CONSOLIDATED FINANCIAL STATEMENTS (Continued)
(In thousands, except share and per share data)
(17) Capitalized Lease Obligation and Receivables (Continued)
At December 31, 2014, future receipts under these leases are as follows:
2015 |
$ | 487 | ||
2016 |
395 | |||
2017 |
194 | |||
2018 |
65 | |||
2019 |
| |||
Thereafter |
| |||
| | | | | |
Total |
1,141 | |||
Less amount representing interest |
(70 | ) | ||
| | | | | |
|
$ | 1,071 | ||
| | | | | |
| | | | | |
| | | | | |
(18) Fair Value Measurements
The Company follows the authoritative guidance for fair value measurements with respect to assets and liabilities that are measured at fair value on a recurring basis and nonrecurring basis. Under the standard, fair value is defined as the exit price, or the amount that would be received to sell an asset or paid to transfer a liability in an orderly transaction between market participants, as of the measurement date. The standard also establishes a hierarchy for inputs used in measuring fair value that maximizes the use of observable inputs and minimizes the use of unobservable inputs by requiring that the most observable inputs be used when available. Observable inputs are inputs market participants would use in valuing the asset or liability developed based on market data obtained from sources independent of the Company. Unobservable inputs are inputs that reflect the Company's assumptions about the factors market participants would use in valuing the asset or liability developed based upon the best information available in the circumstances. The hierarchy consists of the following three levels: Level 1 inputs are quoted prices (unadjusted) in active markets for identical assets or liabilities; Level 2 inputs include quoted prices for similar assets or liabilities in active markets, quoted prices for identical or similar assets or liabilities in markets that are not active, and inputs (other than quoted prices) that are observable for the asset or liability, either directly or indirectly; Level 3 inputs are unobservable inputs for the asset or liability. Categorization within the valuation hierarchy is based upon the lowest level of input that is significant to the fair value measurement.
During the twelve months ended December 31, 2014, the Company's financial instruments consisted of available-for-sale securities, debt instruments, a contingent consideration obligation, and its Series I warrants. For available-for-sale securities, the fair value is determined by the most recent trading prices available for each security or for comparable securities, and thus represent Level 2 fair value measurements. The Company uses projected financial results for the respective entity, discounted to reflect the time value of money, to value its contingent consideration obligations, which is considered to be a Level 3 fair value measurement. The fair values of the Company's debt instruments approximated their carrying values at December 31, 2013 and 2014. The Company uses the Black-Scholes model to value the Series I Warrants. The Company believes the best method to approximate a market participant's view of the volatility of its Series I Warrants has been to use the implied volatilities of its short-term (i.e. 3 to 9 month) traded options and extrapolate the data over the remaining term of the Series I Warrants, which was approximately 1.33 years as of December 31, 2014. This method has
106
CLEAN ENERGY FUELS CORP. AND SUBSIDIARIES
NOTES TO CONSOLIDATED FINANCIAL STATEMENTS (Continued)
(In thousands, except share and per share data)
(18) Fair Value Measurements (Continued)
been utilized consistently in the periods presented. Given that the extrapolation beyond the term of the short term exchange traded options is not based on observable market inputs for a significant portion of the remaining term of the warrants, the Series I Warrants have been classified as a Level 3 fair value measurement.
The following tables provide information by level for assets and liabilities that are measured at fair value on a recurring basis as of December 31, 2013 and December 31, 2014, respectively:
Description
|
Balance at December 31, 2013 |
Level 1 | Level 2 | Level 3 | |||||||||
|---|---|---|---|---|---|---|---|---|---|---|---|---|---|
Assets: |
|||||||||||||
Available-for-sale securities(1): |
|||||||||||||
Certificate of deposits |
$ | 35,621 | $ | | $ | 35,621 | $ | | |||||
Municipal bonds and notes |
59,795 | | 59,795 | | |||||||||
Corporate bonds |
42,824 | | 42,824 | | |||||||||
Liabilities: |
|||||||||||||
Contingent consideration obligation |
384 | | | 384 | |||||||||
Series I Warrants(2) |
7,164 | | | 7,164 | |||||||||
Description
|
Balance at December 31, 2014 |
Level 1 | Level 2 | Level 3 | |||||||||
|---|---|---|---|---|---|---|---|---|---|---|---|---|---|
Assets: |
|||||||||||||
Available-for-sale securities(1): |
|||||||||||||
Certificate of deposits |
$ | 35,355 | $ | | $ | 35,355 | $ | | |||||
Municipal bonds and notes |
38,652 | | 38,652 | | |||||||||
Zero coupon bonds |
3,306 | | 3,306 | | |||||||||
Corporate bonds |
45,233 | | 45,233 | | |||||||||
Liabilities: |
|||||||||||||
Contingent consideration obligation |
| | | | |||||||||
Series I Warrants(2) |
1,416 | | | 1,416 | |||||||||
- (1)
- Included
in short-term investments in the consolidated balance sheets. See note 4 for further information.
- (2)
- Included in other long-term liabilities in the consolidated balance sheets.
107
CLEAN ENERGY FUELS CORP. AND SUBSIDIARIES
NOTES TO CONSOLIDATED FINANCIAL STATEMENTS (Continued)
(In thousands, except share and per share data)
(18) Fair Value Measurements (Continued)
The following tables provide a reconciliation of the beginning and ending balances of items measured at fair value on a recurring basis in the tables above that used significant unobservable inputs (Level 3).
Liabilities: Contingent Consideration
|
2013 | 2014 | |||||
|---|---|---|---|---|---|---|---|
Beginning Balance |
$ | 1,516 | $ | 384 | |||
Gain included in earnings |
(1,132 | ) | (208 | ) | |||
Payments |
| (176 | ) | ||||
Transfers In/Out |
| | |||||
| | | | | | | | |
Ending Balance |
$ | 384 | | ||||
| | | | | | | | |
| | | | | | | | |
| | | | | | | | |
Liabilities: Series I Warrants
|
2013 | 2014 | |||||
|---|---|---|---|---|---|---|---|
Beginning Balance |
$ | 8,102 | $ | 7,164 | |||
Gain included in earnings |
(938 | ) | (5,748 | ) | |||
Issuance of warrants |
| | |||||
Exercise of warrants |
| | |||||
Transfers In/Out |
| | |||||
| | | | | | | | |
Ending Balance |
$ | 7,164 | $ | 1,416 | |||
| | | | | | | | |
| | | | | | | | |
| | | | | | | | |
There were no long-lived asset impairments in 2013. In the fourth quarter of 2014, the Company determined that a long-lived intangible asset related to a contract acquired in the IMW acquisition was impaired due to the cancellation of the contract. Accordingly, the Company recorded an impairment charge of $4,772 related to intangible assets.
Valuation processes for Level 3 fair value measurements and sensitivity to changes in significant unobservable inputs
Fair value measurements of liabilities which fall within Level 3 of the fair value hierarchy are determined by the Company's accounting department, who report to the Company's Chief Financial Officer. The fair value measurements are compared to those of the prior reporting periods to ensure that changes are consistent with expectations of management based upon the sensitivity and nature of the inputs.
108
CLEAN ENERGY FUELS CORP. AND SUBSIDIARIES
NOTES TO CONSOLIDATED FINANCIAL STATEMENTS (Continued)
(In thousands, except share and per share data)
(18) Fair Value Measurements (Continued)
Series I Warrant Liability
The Company estimated the fair value of its Series I Warrant liability using the Black-Scholes model based on the following inputs as of December 31, 2014:
Unobservable Input
|
Range or Weighted Average | |
|---|---|---|
Current market price of the Company's common stock |
$5.00 | |
Exercise price of the warrant |
$12.68 | |
Dividend yield |
0.00% | |
Remaining term of the warrant |
1.33 | |
Implied volatility of the Company's common stock |
85.0% - 85.9% | |
Assumed discount rate |
Simple average of 0.46% |
Significant changes in any of those inputs in isolation can result in a significant change in the fair value measurement. Generally, a positive change in the market price of the Company's common stock, an increase in the volatility of the Company's common stock, or an increase in the remaining term of the warrant would result in a directionally similar change in the estimated fair value of the Company's Series I Warrants and thus an increase in the associated liability. An increase in the assumed discount rate or a decrease in the positive differential between the warrant's exercise price and the market price of the Company's common stock would result in a decrease in the estimated fair value measurement of the Series I Warrants and thus a decrease in the associated liability. The Company has not, nor does it plan to, declare dividends on its common stock, and thus, there is no directionally similar change in the estimated fair value of the warrants due to the dividend assumption.
(19) Subsequent Events
None.
109
Item 9. Changes in and Disagreements with Accountants on Accounting and Financial Disclosure.
None.
Item 9A. Controls and Procedures.
Evaluation of Disclosure Controls and Procedures.
Our management, under the supervision and with the participation of our Chief Executive Officer and Chief Financial Officer (our principal executive and principal financial officers, respectively), evaluated the effectiveness of our disclosure controls and procedures pursuant to Rule 13a-15 under the Exchange Act. Our controls and procedures are designed to ensure that information required to be disclosed in the reports that we file or submit under the Exchange Act is recorded, processed, summarized and reported within the time periods specified in the Securities and Exchange Commission rules and forms, and that such information is accumulated and communicated to our management, including our Chief Executive Officer and Chief Financial Officer, as appropriate, to allow timely decisions regarding required disclosure. In designing and evaluating the disclosure controls and procedures, management recognizes that any controls and procedures, no matter how well designed and operated, can provide only reasonable assurance of achieving the desired control objectives. In addition, the design of disclosure controls and procedures must reflect the fact that there are resource constraints and that management is required to apply its judgment in evaluating the benefits of possible controls and procedures relative to their costs.
Based on management's evaluation, our Chief Executive Officer and Chief Financial Officer concluded that, as of December 31, 2014, our disclosure controls and procedures were effective.
Changes in Internal Control over Financial Reporting.
We regularly review our system of internal control over financial reporting and make changes to our processes and systems to improve controls and increase efficiency, while ensuring that we maintain an effective internal control environment. Changes may include such activities as implementing new, more efficient systems, consolidating activities, and migrating processes.
There were no changes in our internal control over financial reporting that occurred during our most recent fiscal quarter that have materially affected, or are reasonably likely to materially affect, our internal control over financial reporting.
Management's Report on Internal Control Over Financial Reporting
Our management is responsible for establishing and maintaining adequate internal control over our financial reporting (as defined in Rule 13a-15(f) under the Exchange Act). Our management, with the participation of our Chief Executive Officer and Chief Financial Officer, assessed the effectiveness of our internal control over financial reporting as of December 31, 2014. In making its assessment of the effectiveness of our internal control over financial reporting, our management used the criteria set forth by the Committee of Sponsoring Organizations of the Treadway Commission ("COSO") in Internal ControlIntegrated Framework (1992). Based on these criteria, our management has concluded that, as of December 31, 2014, our internal control over financial reporting is effective. Our independent registered public accounting firm, KPMG LLP, has issued an attestation on our internal control over financial reporting, which is included in Part II, Item 8 of this annual report on Form 10-K.
None.
110
Item 10. Directors, Executive Officers and Corporate Governance.
The information required by this item is incorporated by reference to the proxy statement for our 2015 Annual Meeting of Stockholders to be filed with the Securities and Exchange Commission within 120 days after the end of the fiscal year ended December 31, 2014.
Item 11. Executive Compensation.
The information required by this item is incorporated by reference to the proxy statement for our 2015 Annual Meeting of Stockholders to be filed with the Securities and Exchange Commission within 120 days after the end of the fiscal year ended December 31, 2014.
Item 12. Security Ownership of Certain Beneficial Owners and Management and Related Stockholder Matters.
The information required by this item is incorporated by reference to the proxy statement for our 2015 Annual Meeting of Stockholders to be filed with the Securities and Exchange Commission within 120 days after the end of the fiscal year ended December 31, 2014.
Item 13. Certain Relationships and Related Transactions and Director Independence.
The information required by this item is incorporated by reference to the proxy statement for our 2015 Annual Meeting of Stockholders to be filed with the Securities and Exchange Commission within 120 days after the end of the fiscal year ended December 31, 2014.
Item 14. Principal Accounting Fees and Services.
The information required by this item is incorporated by reference to the proxy statement for our 2015 Annual Meeting of Stockholders to be filed with the Securities and Exchange Commission within 120 days after the end of the fiscal year ended December 31, 2014.
111
Item 15. Exhibits and Financial Statement Schedules.
(a)(1) Consolidated Financial Statements.
The following documents are filed in Part II, Item 8 of this annual report on Form 10-K:
Report of Independent Registered Public Accounting Firm |
||
Consolidated Balance Sheets as of December 31, 2013 and 2014 |
||
Consolidated Statements of Operations for the Years Ended December 31, 2012, 2013 and 2014 |
||
Consolidated Statements of Comprehensive Income (Loss) for the Years Ended December 31, 2012, 2013 and 2014 |
||
Consolidated Statements of Stockholders' Equity for the Years Ended December 31, 2012, 2013 and 2014 |
||
Consolidated Statements of Cash Flows for the Years Ended December 31, 2012, 2013 and 2014 |
||
Notes to Consolidated Financial Statements |
(a)(2) Financial Statement Schedules.
The financial statement schedule set forth below is filed as a part of this annual report on Form 10-K . All other schedules have been omitted as they are not required, not applicable, or the required information is otherwise included.
Schedule II: Valuation and Qualifying Accounts
|
|
Allowances for Doubtful Trade Receivables |
Allowance for Doubtful Notes Receivables |
|||||
|---|---|---|---|---|---|---|---|
Balance at December 31, 2011 |
$ | 712 | $ | 20 | |||
Charges (benefit) to operations |
435 | 924 | |||||
Deductions |
(242 | ) | (35 | ) | |||
| | | | | | | | |
Balance at December 31, 2012 |
905 | 909 | |||||
Charges (benefit) to operations |
454 | 1,507 | |||||
Deductions |
(527 | ) | | ||||
| | | | | | | | |
Balance at December 31, 2013 |
832 | 2,416 | |||||
Charges (benefit) to operations |
387 | 890 | |||||
Deductions |
(467 | ) | (456 | ) | |||
| | | | | | | | |
Balance at December 31, 2014 |
$ | 752 | $ | 2,850 | |||
| | | | | | | | |
| | | | | | | | |
| | | | | | | | |
112
(a)(3) Exhibits.
|
|
|
Incorporated herein by reference to the following filings: | |||||
|---|---|---|---|---|---|---|---|
| Exhibit Number |
|
||||||
| Description | Form | Filed on | |||||
| 2.8 | Stock Purchase Agreement dated May 6, 2013, among Mansfield Energy Corp., Mansfield Gas Equipment Systems Corporation, and Clean Energy. | Filed as Exhibit 2.8 to the Current Report on Form 8-K. | May 7, 2013 | ||||
|
2.9 |
Stock Purchase Agreement dated June 28, 2013, among Westport Innovations (U.S.) Holdings Inc., Westport Innovations Inc., Clean Energy and BAF Technologies, Inc. |
Filed as Exhibit 2.9 to the Current Report on Form 8-K. |
June 28, 2013 |
||||
|
2.10 |
Membership Interest Purchase Agreement dated December 29, 2014, between Mavrix, LLC and Cambrian Energy McCommas Bluff III LLC. |
Filed as Exhibit 2.10 on the Current Report on Form 8-K. |
January 5, 2015 |
||||
|
3.1 |
Restated Certificate of Incorporation. |
Filed as Exhibit 3.1 to the Registration Statement on Form S-1, as amended. |
March 27, 2007 |
||||
|
3.1.1 |
Restated Certificate of Incorporation, as amended, by the Certificate of Amendment to the Restated Certificate of Incorporation of Registrant dated May 28, 2010. |
Filed as Exhibit 3.1.1 to the Quarterly Report on Form 10-Q for the quarter ended June 30, 2010. |
August 9, 2010 |
||||
|
3.1.2 |
Restated Certificate of Incorporation, as amended by the Certificate of Amendment to the Restated Certificate of Incorporation of the Registrant dated May 28, 2010, as further amended by the Certificate of Amendment to the Restated Certificate of Incorporation of the Registrant dated May 8, 2014. |
Filed as Exhibit 3.1.2 to the Quarterly Report on Form 10-Q for the quarter ended June 30, 2014. |
August 7, 2014 |
||||
|
3.2 |
Amended and Restated Bylaws. |
Filed as Exhibit 3.2 to the Current Report on Form 8-K. |
February 23, 2011 |
||||
|
3.2.1 |
Amendment No. 1 to Amended and Restated Bylaws. |
Filed as Exhibit 3.2.1 to the Current Report on Form 8-K. |
August 7, 2014 |
||||
|
4.1 |
Specimen Common Stock Certificate. |
Filed as Exhibit 4.1 to the Registration Statement on Form S-1, as amended. |
March 27, 2007 |
||||
113
|
|
|
Incorporated herein by reference to the following filings: | |||||
|---|---|---|---|---|---|---|---|
| Exhibit Number |
|
||||||
| Description | Form | Filed on | |||||
| 4.5 | Form of Warrant to Purchase Common Stock. | Filed as Exhibit 4.5 to the Current Report on Form 8-K. | October 29, 2008 | ||||
|
4.6 |
Convertible Promissory Note issued by the Registrant to Chesapeake NG Ventures Corporation. |
Filed as Exhibit 4.6 to the Current Report on Form 8-K. |
July 11, 2011 |
||||
|
4.7 |
Form of Convertible Note. |
Filed as Exhibit 4.7 to the Current Report on Form 8-K. |
August 30, 2011 |
||||
|
4.8 |
Warrant to Purchase Common Stock dated November 7, 2012, issued by the Registrant to GE Energy Financial Services, Inc. |
Filed as Exhibit 4.8 to the Current Report on Form 8-K. |
November 13, 2012 |
||||
|
4.9 |
Secured Promissory Note dated April 25, 2013, issued by Mavrix, LLC to Massachusetts Mutual Life Insurance Company. |
Filed as Exhibit 4.9 to the Current Report on Form 8-K. |
April 26, 2013 |
||||
|
4.10 |
Form of Replacement Note issued by the Registrant. |
Filed as Exhibit 4.9 to the Current Report on Form 8-K. |
June 18, 2013 |
||||
|
4.11 |
Indenture dated September 16, 2013, between the Registrant and U.S. Bank National Association. |
Filed as Exhibit 4.11 to the Current Report on Form 8-K. |
September 16, 2013 |
||||
|
4.12 |
Form of 5.25% Convertible Senior Note due 2018. |
Included with Exhibit 4.11 to the Current Report on Form 8-K. |
September 16, 2013 |
||||
|
4.13 |
Promissory Note in the principal amount of $18,650,300 dated October 14, 2014, issued by Clean Energy to NG Advantage, LLC. |
Filed as Exhibit 4.13 to the Current Report on Form 8-K. |
October 15, 2014 |
||||
|
4.14 |
Promissory Note in the principal amount of $1,800,000 dated October 14, 2014, issued by Clean Energy to NG Advantage, LLC. |
Filed as Exhibit 4.14 to the Current Report on Form 8-K. |
October 15, 2014 |
||||
|
4.15 |
Warrant Amendment dated December 29, 2014, among Clean Energy Fuels Corp., General Electric Company and GPFS Securities Inc. |
Filed as Exhibit 4.15 to the Current Report on Form 8-K. |
January 5, 2015 |
||||
|
10.1 |
+ |
2002 Stock Option Plan, Amendment and Form of Stock Option Agreement. |
Filed as Exhibit 10.1 to the Registration Statement on Form S-1, as amended. |
September 6, 2006 |
|||
|
10.4 |
+ |
Form of Indemnification Agreement. |
Filed as Exhibit 10.4 to the Registration Statement on Form S-1, as amended. |
March 27, 2007 |
|||
114
|
|
|
Incorporated herein by reference to the following filings: | |||||
|---|---|---|---|---|---|---|---|
| Exhibit Number |
|
||||||
| Description | Form | Filed on | |||||
| 10.5 | + | Amended and Restated 2002 Stock Option Plan dated August 10, 2007. | Filed as Exhibit 99.1 to the Registration Statement on Form S-8. | August 14, 2007 | |||
|
10.6 |
+ |
Stock Option Agreement dated May 18, 2006 between the Registrant and G. Michael Boswell. |
Filed as Exhibit 99.3 to the Registration Statement on Form S-8. |
August 14, 2007 |
|||
|
10.7 |
+ |
2006 Equity Incentive PlanForm of Notice of Stock Option Grant and Stock Option Agreement. |
Filed as Exhibit 99.5 to the Registration Statement on Form S-8. |
August 14, 2007 |
|||
|
10.12 |
|
Ground Lease dated November 3, 2006 among the Registrant, Clean Energy Construction and U.S. Borax, Inc. |
Filed as Exhibit 10.25 to the Registration Statement on Form S-1, as amended. |
May 24, 2007 |
|||
|
10.16 |
+ |
2006 Equity Incentive PlanForm of Stock Award Agreement. |
Filed as Exhibit 10.2 to the Quarterly Report on Form 10-Q for the quarter ended March 31, 2008. |
May 15, 2008 |
|||
|
10.21 |
+ |
Amendment No. 1 to Amended and Restated 2002 Stock Option Plan. |
Filed as Exhibit 10.36 to the Annual Filing on Form 10-K for the fiscal year ended 2007. |
March 19, 2008 |
|||
|
10.24 |
+ |
Amended and Restated Employment Agreement dated December 31, 2008, between the Registrant and Andrew J. Littlefair. |
Filed as Exhibit 99.1 to the Current Report on Form 8-K. |
December 31, 2008 |
|||
|
10.25 |
+ |
Amended and Restated Employment Agreement dated December 31, 2008, between the Registrant and Richard R. Wheeler. |
Filed as Exhibit 99.2 to the Current Report on Form 8-K. |
December 31, 2008 |
|||
|
10.26 |
+ |
Amended and Restated Employment Agreement dated December 31, 2008, between the Registrant and Mitchell W. Pratt. |
Filed as Exhibit 99.3 to the Current Report on Form 8-K. |
December 31, 2008 |
|||
|
10.27 |
+ |
Amended and Restated Employment Agreement dated December 31, 2008, between the Registrant and James N. Harger. |
Filed as Exhibit 99.4 to the Current Report on Form 8-K. |
December 31, 2008 |
|||
|
10.37 |
+ |
Employment Agreement dated February 17, 2010, between the Registrant and Barclay Corbus. |
Filed as Exhibit 99.1 to the Current Report on Form 8-K. |
February 18, 2010 |
|||
115
|
|
|
Incorporated herein by reference to the following filings: | |||||
|---|---|---|---|---|---|---|---|
| Exhibit Number |
|
||||||
| Description | Form | Filed on | |||||
| 10.60 | Form of Convertible Note Purchase Agreement. | Filed as Exhibit 10.60 to the Current Report on Form 8-K. | August 30, 2011 | ||||
|
10.61 |
Form of Registration Rights Agreement. |
Filed as Exhibit 10.61 to the Current Report on Form 8-K. |
August 30, 2011 |
||||
|
10.63 |
+ |
Amended and Restated 2006 Equity Incentive Plan. |
Filed as Exhibit 10.63 to the Annual Filing on Form 10-K for the fiscal year ended 2011. |
March 12, 2012 |
|||
|
10.64 |
+ |
Amended and Restated 2006 Equity Incentive PlanForm of Notice of Stock Unit Award and Stock Unit Agreement. |
Filed as Exhibit 10.64 to the Annual Filing on Form 10-K for the fiscal year ended 2011. |
March 12, 2012 |
|||
|
10.65 |
+ |
First Amendment to Amended and Restated Employment Agreement dated February 17, 2012, between the Registrant and Andrew J. Littlefair. |
Filed as Exhibit 10.65 to the Quarterly Report on Form 10-Q for the quarter ended March 31, 2012. |
May 7, 2012 |
|||
|
10.66 |
+ |
First Amendment to Amended and Restated Employment Agreement dated February 17, 2012, between the Registrant and Richard R. Wheeler. |
Filed as Exhibit 10.66 to the Quarterly Report on Form 10-Q for the quarter ended March 31, 2012. |
May 7, 2012 |
|||
|
10.67 |
+ |
First Amendment to Amended and Restated Employment Agreement dated February 17, 2012, between the Registrant and Mitchell W. Pratt. |
Filed as Exhibit 10.67 to the Quarterly Report on Form 10-Q for the quarter ended March 31, 2012. |
May 7, 2012 |
|||
|
10.68 |
+ |
First Amendment to Amended and Restated Employment Agreement dated February 17, 2012, between the Registrant and James N. Harger. |
Filed as Exhibit 10.68 to the Quarterly Report on Form 10-Q for the quarter ended March 31, 2012. |
May 7, 2012 |
|||
|
10.69 |
+ |
First Amendment to Employment Agreement dated February 17, 2012, between the Registrant and Barclay F. Corbus. |
Filed as Exhibit 10.69 to the Quarterly Report on Form 10-Q for the quarter ended March 31, 2012. |
May 7, 2012 |
|||
116
|
|
|
Incorporated herein by reference to the following filings: | |||||
|---|---|---|---|---|---|---|---|
| Exhibit Number |
|
||||||
| Description | Form | Filed on | |||||
| 10.70 | Credit Agreement dated November 7, 2012, among Clean Energy Tranche A LNG Plant, LLC and Clean Energy Tranche B LNG Plant, LLC, as Borrowers, the Various Financial Institutions from Time to Time Party thereto, as Lenders, and General Electric Capital Corporation, as Administrative Agent and Collateral Agent . | Filed as Exhibit 10.70 to the Current Report on Form 8-K. | November 13, 2012 | ||||
|
10.71 |
|
Guaranty dated November 7, 2012, issued by the Registrant to General Electric Capital Corporation . |
Filed as Exhibit 10.71 to the Annual Report on Form 10-K for the year ended December 31, 2012. |
February 28, 2013 |
|||
|
10.72 |
Equity Contribution Agreement dated November 7, 2012, among Clean Energy Tranche A LNG Plant, LLC and Clean Energy Tranche B LNG Plant, LLC, as Borrowers, the Registrant, as Equity Investor, and General Electric Capital Corporation, as Administrative Agent and Collateral Agent . |
Filed as Exhibit 10.72 to the Current Report on Form 8-K. |
November 13, 2012 |
||||
|
10.73 |
Warrant Agreement dated November 7, 2012, between the Registrant and GE Energy Financial Services, Inc. |
Filed as Exhibit 10.73 to the Current Report on Form 8-K. |
November 13, 2012 |
||||
|
10.74 |
Registration Rights Agreement dated November 7, 2012, between the Registrant and GE Energy Financial Services, Inc. |
Filed as Exhibit 10.74 to the Current Report on Form 8-K. |
November 13, 2012 |
||||
|
10.75 |
+ |
Second Amendment to Amended and Restated Employment Agreement dated December 12, 2012, between the Registrant and Andrew J. Littlefair. |
Filed as Exhibit 10.75 to the Annual Report on Form 10-K for the year ended December 31, 2012. |
February 28, 2013 |
|||
|
10.76 |
+ |
Second Amendment to Amended and Restated Employment Agreement dated December 12, 2012, between the Registrant and Richard R. Wheeler. |
Filed as Exhibit 10.76 to the Annual Report on Form 10-K for the year ended December 31, 2012. |
February 28, 2013 |
|||
117
|
|
|
Incorporated herein by reference to the following filings: | |||||
|---|---|---|---|---|---|---|---|
| Exhibit Number |
|
||||||
| Description | Form | Filed on | |||||
| 10.77 | + | Second Amendment to Amended and Restated Employment Agreement dated December 12, 2012, between the Registrant and Mitchell W. Pratt. | Filed as Exhibit 10.77 to the Annual Report on Form 10-K for the year ended December 31, 2012. | February 28, 2013 | |||
|
10.78 |
+ |
Second Amendment to Amended and Restated Employment Agreement dated December 12, 2012, between the Registrant and James N. Harger. |
Filed as Exhibit 10.78 to the Annual Report on Form 10-K for the year ended December 31, 2012. |
February 28, 2013 |
|||
|
10.79 |
+ |
Second Amendment to Employment Agreement dated December 12, 2012, between the Registrant and Barclay F. Corbus. |
Filed as Exhibit 10.79 to the Annual Report on Form 10-K for the year ended December 31, 2012. |
February 28, 2013 |
|||
|
10.80 |
Lease dated March 18, 2013, between The Irvine Company LLC and Clean Energy. |
Filed as Exhibit 10.80 to the Quarterly Report on Form 10-Q for the quarter ended March 31, 2013. |
May 8, 2013 |
||||
|
10.81 |
First Amendment to Lease dated April 17, 2013, between The Irvine Company LLC and Clean Energy. |
Filed as Exhibit 10.81 to the Quarterly Report on Form 10-Q for the quarter ended March 31, 2013. |
May 8, 2013 |
||||
|
10.82 |
Note Purchase Agreement dated April 25, 2013, between Mavrix, LLC and Massachusetts Mutual Life Insurance Company |
Filed as Exhibit 10.82 to the Current Report on Form 8-K |
April 26, 2013 |
||||
|
10.83 |
Note Purchase Agreement dated June 14, 2013, among the Registrant, Chesapeake NG Ventures Corporation, Boone Pickens and Green Energy Investment Holdings, LLC. |
Filed as Exhibit 10.83 to the Current Report on Form 8-K. |
June 18, 2013 |
||||
|
10.84 |
Loan Agreement dated June 14, 2013, between the Registrant and Green Energy Investment Holdings, LLC. |
Filed as Exhibit 10.84 to the Current Report on Form 8-K. |
June 18, 2013 |
||||
|
10.85 |
Loan Agreement dated June 14, 2013, between the Registrant and Boone Pickens. |
Filed as Exhibit 10.85 to the Current Report on Form 8-K. |
June 18, 2013 |
||||
|
10.86 |
Registration Rights Agreement dated June 14, 2013, among the Registrant, Boone Pickens and Green Energy Investment Holdings, LLC. |
Filed as Exhibit 10.86 to the Current Report on Form 8-K. |
June 18, 2013 |
||||
118
|
|
|
Incorporated herein by reference to the following filings: | |||||
|---|---|---|---|---|---|---|---|
| Exhibit Number |
|
||||||
| Description | Form | Filed on | |||||
| 10.87 | Marketing Agreement dated June 28, 2013, among Clean Energy, Westport Power Inc. and Westport Fuel Systems Inc. | Filed as Exhibit 10.87 to the Current Report on Form 8-K. | June 28, 2013 | ||||
|
10.88 |
Registration Rights Agreement dated June 28, 2013, between Clean Energy and Westport Innovations Inc. |
Filed as Exhibit 10.88 to the Current Report on Form 8-K. |
June 28, 2013 |
||||
|
10.89 |
+ |
Third Amendment to Amended and Restated Employment Agreement dated May 6, 2013, between the Registrant and James N. Harger. |
Filed as Exhibit 10.89 to the Quarterly Report on Form 10-Q for the quarter ended June 30, 2013. |
August 8, 2013 |
|||
|
10.90 |
+ |
Clean Energy Fuels Corp. Employee Stock Purchase Plan. |
Filed as Exhibit Annex A to Schedule 14A Definitive Proxy Statement. |
March 28, 2013 |
|||
|
10.91 |
+ |
Clean Energy Renewable Fuels, LLC Unit Option Plan, Form of Notice of Option Award and Option Agreement. |
Filed as Exhibit 10.91 to the Quarterly Report on Form 10-Q for the quarter ended September 30, 2013. |
November 7, 2013 |
|||
|
10.92 |
|
Liquefied Natural Gas Fueling Station and LNG Master Sales Agreement dated August 2, 2010, between Clean Energy and Pilot Travel Centers, LLC. |
Filed as Exhibit 10.92 to the Annual Report on Form 10-K for the year ended December 31, 2013. |
February 27, 2014 |
|||
|
10.93 |
Loan Agreement dated March 1, 2014, between Canton Renewables, LLC and Michigan Strategic Fund. |
Filed as Exhibit 10.93 to the Current Report on Form 8-K. |
March 21, 2014 |
||||
|
10.94 |
Form of Common Unit Purchase Agreement dated October 14, 2014, among NG Advantage, LLC, Clean Energy and the other investors named therein. |
Filed as Exhibit 10.94 to the Company's Current Report on Form 8-K. |
October 15, 2014 |
||||
|
10.95 |
Purchase Agreement dated October 14, 2014, between Clean Energy and NG Advantage, LLC. |
Filed as Exhibit 10.95 to the Company's Current Report on Form 8-K. |
October 15, 2014 |
||||
|
10.96 |
Lease dated October 14, 2014, between Clean Energy and NG Advantage, LLC. |
Filed as Exhibit 10.96 to the Company's Current Report on Form 8-K. |
October 15, 2014 |
||||
119
|
|
|
Incorporated herein by reference to the following filings: | |||||
|---|---|---|---|---|---|---|---|
| Exhibit Number |
|
||||||
| Description | Form | Filed on | |||||
| 10.97 | Amendment to Credit Agreement dated December 29, 2014, among Clean Energy Tranche A LNG Plant, LLC, Clean Energy Tranche B LNG Plant, LLC and General Electric Capital Corporation. | Filed as Exhibit 10.97 to the Company's Current Report on Form 8-K. | January 5, 2015 | ||||
|
10.98 |
+* |
Separation Agreement and Release dated November 3, 2014, between the Registrant and Richard R. Wheeler. |
|
|
|||
|
10.99 |
+* |
Retirement Agreement dated December 29, 2014, between the Registrant and James N. Harger. |
|
|
|||
|
10.100 |
+* |
Offer Letter dated December 29, 2014, between the Registrant and James N. Harger. |
|
|
|||
|
10.101 |
+* |
Offer Letter dated October 28, 2014, between the Registrant and Robert M. Vreeland. |
|
|
|||
|
21.1 |
* |
Subsidiaries. |
|
|
|||
|
23.1 |
* |
Consent of Independent Registered Public Accounting Firm KPMG LLP. |
|
|
|||
|
31.1 |
* |
Certification of Andrew J. Littlefair, President and Chief Executive Officer, pursuant to Rule 13a-14(a) or 15d-14(a) of the Securities and Exchange Act of 1934, as adopted pursuant to Section 302 of the Sarbanes- Oxley Act of 2002. |
|
|
|||
|
31.2 |
* |
Certification of Robert M. Vreeland, Chief Financial Officer, pursuant to Rule 13a-14(a) or 15d-14(a) of the Securities and Exchange Act of 1934, as adopted pursuant to Section 302 of the Sarbanes-Oxley Act of 2002. |
|
|
|||
120
|
|
|
Incorporated herein by reference to the following filings: | |||||
|---|---|---|---|---|---|---|---|
| Exhibit Number |
|
||||||
| Description | Form | Filed on | |||||
| 32.1 | ** | Certification pursuant to 18 U.S.C. Section 1350, as adopted pursuant to Section 906 of the Sarbanes-Oxley Act of 2002, executed by Andrew J. Littlefair, President and Chief Executive Officer, and Robert M. Vreeland Chief Financial Officer. | |||||
|
99.1 |
Natural Gas Hedge Policy dated May 29, 2008. |
Filed as Exhibit 99.1 to the Current Report on Form 8-K. |
June 20, 2008 |
||||
|
101 |
The following materials from the Company's Annual Report on Form 10-K for the year ended December 31, 2014, formatted in XBRL (eXtensible Business Reporting Language): |
|
|
||||
|
(i) Consolidated Balance Sheets; |
|
|
|||||
|
(ii) Consolidated Statements of Operations; |
|
|
|||||
|
(iii) Consolidated Statements of Comprehensive Income (Loss); |
|
|
|||||
|
(iv) Consolidated Statements of Stockholders' Equity; |
|
|
|||||
|
(v) Consolidated Statements of Cash Flows; and |
|
|
|||||
|
(vi) Notes to Consolidated Financial Statements. |
|
|
|||||
-
- Portions
of this exhibit have been omitted pursuant to the grant of a request for confidential treatment and the non-public information has been
filed separately with the SEC.
- *
- Filed
herewith.
- **
- Furnished
herewith.
- +
- Management contract or compensatory plan or arrangement.
121
Pursuant to the requirements of Section 13 or 15(d) of the Securities Exchange Act of 1934, the registrant has duly caused this report to be signed on its behalf by the undersigned, thereunto duly authorized.
|
CLEAN ENERGY FUELS CORP. | |||
|
By: |
/s/ ANDREW J. LITTLEFAIR |
||
Date: February 26, 2015
Pursuant to the requirements of the Securities Exchange Act of 1934, this report has been signed below by the following persons on behalf of the registrant and in the capacities and on the dates indicated.
Signature
|
Title
|
Date
|
||||
|---|---|---|---|---|---|---|
|
|
||||||
|
/s/ ANDREW J. LITTLEFAIR Andrew J. Littlefair |
President, Chief Executive Officer (Principal Executive Officer) and a Director | February 26, 2015 | ||||
|
/s/ ROBERT M. VREELAND Robert M. Vreeland |
Chief Financial Officer (Principal Financial Officer and Principal Accounting Officer) |
February 26, 2015 |
||||
|
/s/ WARREN I. MITCHELL Warren I. Mitchell |
Chairman of the Board and Director |
February 26, 2015 |
||||
|
/s/ VINCENT C. TAORMINA Vincent C. Taormina |
Director |
February 26, 2015 |
||||
|
/s/ JOHN S. HERRINGTON John S. Herrington |
Director |
February 26, 2015 |
||||
|
/s/ JAMES C. MILLER III James C. Miller III |
Director |
February 26, 2015 |
||||
|
/s/ BOONE PICKENS Boone Pickens |
Director |
February 26, 2015 |
||||
122
Signature
|
Title
|
Date
|
||||
|---|---|---|---|---|---|---|
|
|
||||||
|
/s/ JAMES E. O'CONNOR James E. O'Connor |
Director | February 26, 2015 | ||||
|
/s/ KENNETH M. SOCHA Kenneth M. Socha |
Director |
February 26, 2015 |
||||
|
/s/ STEPHEN A. SCULLY Stephen A. Scully |
Director |
February 26, 2015 |
||||
123
|
|
|
Incorporated herein by reference to the following filings: | |||||
|---|---|---|---|---|---|---|---|
| Exhibit Number |
|
||||||
| Description | Form | Filed on | |||||
| 2.8 | Stock Purchase Agreement dated May 6, 2013, among Mansfield Energy Corp., Mansfield Gas Equipment Systems Corporation, and Clean Energy. | Filed as Exhibit 2.8 to the Current Report on Form 8-K. | May 7, 2013 | ||||
|
2.9 |
Stock Purchase Agreement dated June 28, 2013, among Westport Innovations (U.S.) Holdings Inc., Westport Innovations Inc., Clean Energy and BAF Technologies, Inc. |
Filed as Exhibit 2.9 to the Current Report on Form 8-K. |
June 28, 2013 |
||||
|
2.10 |
Membership Interest Purchase Agreement dated December 29, 2014, between Mavrix, LLC and Cambrian Energy McCommas Bluff III LLC. |
Filed as Exhibit 2.10 on the Current Report on Form 8-K. |
January 5, 2015 |
||||
|
3.1 |
Restated Certificate of Incorporation. |
Filed as Exhibit 3.1 to the Registration Statement on Form S-1, as amended. |
March 27, 2007 |
||||
|
3.1.1 |
Restated Certificate of Incorporation, as amended, by the Certificate of Amendment to the Restated Certificate of Incorporation of Registrant dated May 28, 2010. |
Filed as Exhibit 3.1.1 to the Quarterly Report on Form 10-Q for the quarter ended June 30, 2010. |
August 9, 2010 |
||||
|
3.1.2 |
Restated Certificate of Incorporation, as amended by the Certificate of Amendment to the Restated Certificate of Incorporation of the Registrant dated May 28, 2010, as further amended by the Certificate of Amendment to the Restated Certificate of Incorporation of the Registrant dated May 8, 2014. |
Filed as Exhibit 3.1.2 to the Quarterly Report on Form 10-Q for the quarter ended June 30, 2014. |
August 7, 2014 |
||||
|
3.2 |
Amended and Restated Bylaws. |
Filed as Exhibit 3.2 to the Current Report on Form 8-K. |
February 23, 2011 |
||||
|
3.2.1 |
Amendment No. 1 to Amended and Restated Bylaws. |
Filed as Exhibit 3.2.1 to the Current Report on Form 8-K. |
August 7, 2014 |
||||
|
4.1 |
Specimen Common Stock Certificate. |
Filed as Exhibit 4.1 to the Registration Statement on Form S-1, as amended. |
March 27, 2007 |
||||
|
4.5 |
Form of Warrant to Purchase Common Stock. |
Filed as Exhibit 4.5 to the Current Report on Form 8-K. |
October 29, 2008 |
||||
|
|
|
Incorporated herein by reference to the following filings: | |||||
|---|---|---|---|---|---|---|---|
| Exhibit Number |
|
||||||
| Description | Form | Filed on | |||||
| 4.6 | Convertible Promissory Note issued by the Registrant to Chesapeake NG Ventures Corporation. | Filed as Exhibit 4.6 to the Current Report on Form 8-K. | July 11, 2011 | ||||
|
4.7 |
Form of Convertible Note. |
Filed as Exhibit 4.7 to the Current Report on Form 8-K. |
August 30, 2011 |
||||
|
4.8 |
Warrant to Purchase Common Stock dated November 7, 2012, issued by the Registrant to GE Energy Financial Services, Inc. |
Filed as Exhibit 4.8 to the Current Report on Form 8-K. |
November 13, 2012 |
||||
|
4.9 |
Secured Promissory Note dated April 25, 2013, issued by Mavrix, LLC to Massachusetts Mutual Life Insurance Company. |
Filed as Exhibit 4.9 to the Current Report on Form 8-K. |
April 26, 2013 |
||||
|
4.10 |
Form of Replacement Note issued by the Registrant. |
Filed as Exhibit 4.9 to the Current Report on Form 8-K. |
June 18, 2013 |
||||
|
4.11 |
Indenture dated September 16, 2013, between the Registrant and U.S. Bank National Association. |
Filed as Exhibit 4.11 to the Current Report on Form 8-K. |
September 16, 2013 |
||||
|
4.12 |
Form of 5.25% Convertible Senior Note due 2018. |
Included with Exhibit 4.11 to the Current Report on Form 8-K. |
September 16, 2013 |
||||
|
4.13 |
Promissory Note in the principal amount of $18,650,300 dated October 14, 2014, issued by Clean Energy to NG Advantage, LLC. |
Filed as Exhibit 4.13 to the Current Report on Form 8-K. |
October 15, 2014 |
||||
|
4.14 |
Promissory Note in the principal amount of $1,800,000 dated October 14, 2014, issued by Clean Energy to NG Advantage, LLC. |
Filed as Exhibit 4.14 to the Current Report on Form 8-K. |
October 15, 2014 |
||||
|
4.15 |
Warrant Amendment dated December 29, 2014, among Clean Energy Fuels Corp., General Electric Company and GPFS Securities Inc. |
Filed as Exhibit 4.15 to the Current Report on Form 8-K. |
January 5, 2015 |
||||
|
10.1 |
+ |
2002 Stock Option Plan, Amendment and Form of Stock Option Agreement. |
Filed as Exhibit 10.1 to the Registration Statement on Form S-1, as amended. |
September 6, 2006 |
|||
|
10.4 |
+ |
Form of Indemnification Agreement. |
Filed as Exhibit 10.4 to the Registration Statement on Form S-1, as amended. |
March 27, 2007 |
|||
|
10.5 |
+ |
Amended and Restated 2002 Stock Option Plan dated August 10, 2007. |
Filed as Exhibit 99.1 to the Registration Statement on Form S-8. |
August 14, 2007 |
|||
|
|
|
Incorporated herein by reference to the following filings: | |||||
|---|---|---|---|---|---|---|---|
| Exhibit Number |
|
||||||
| Description | Form | Filed on | |||||
| 10.6 | + | Stock Option Agreement dated May 18, 2006 between the Registrant and G. Michael Boswell. | Filed as Exhibit 99.3 to the Registration Statement on Form S-8. | August 14, 2007 | |||
|
10.7 |
+ |
2006 Equity Incentive PlanForm of Notice of Stock Option Grant and Stock Option Agreement. |
Filed as Exhibit 99.5 to the Registration Statement on Form S-8. |
August 14, 2007 |
|||
|
10.12 |
|
Ground Lease dated November 3, 2006 among the Registrant, Clean Energy Construction and U.S. Borax, Inc. |
Filed as Exhibit 10.25 to the Registration Statement on Form S-1, as amended. |
May 24, 2007 |
|||
|
10.16 |
+ |
2006 Equity Incentive PlanForm of Stock Award Agreement. |
Filed as Exhibit 10.2 to the Quarterly Report on Form 10-Q for the quarter ended March 31, 2008. |
May 15, 2008 |
|||
|
10.21 |
+ |
Amendment No. 1 to Amended and Restated 2002 Stock Option Plan. |
Filed as Exhibit 10.36 to the Annual Filing on Form 10-K for the fiscal year ended 2007. |
March 19, 2008 |
|||
|
10.24 |
+ |
Amended and Restated Employment Agreement dated December 31, 2008, between the Registrant and Andrew J. Littlefair. |
Filed as Exhibit 99.1 to the Current Report on Form 8-K. |
December 31, 2008 |
|||
|
10.25 |
+ |
Amended and Restated Employment Agreement dated December 31, 2008, between the Registrant and Richard R. Wheeler. |
Filed as Exhibit 99.2 to the Current Report on Form 8-K. |
December 31, 2008 |
|||
|
10.26 |
+ |
Amended and Restated Employment Agreement dated December 31, 2008, between the Registrant and Mitchell W. Pratt. |
Filed as Exhibit 99.3 to the Current Report on Form 8-K. |
December 31, 2008 |
|||
|
10.27 |
+ |
Amended and Restated Employment Agreement dated December 31, 2008, between the Registrant and James N. Harger. |
Filed as Exhibit 99.4 to the Current Report on Form 8-K. |
December 31, 2008 |
|||
|
10.37 |
+ |
Employment Agreement dated February 17, 2010, between the Registrant and Barclay Corbus. |
Filed as Exhibit 99.1 to the Current Report on Form 8-K. |
February 18, 2010 |
|||
|
10.60 |
Form of Convertible Note Purchase Agreement. |
Filed as Exhibit 10.60 to the Current Report on Form 8-K. |
August 30, 2011 |
||||
|
10.61 |
Form of Registration Rights Agreement. |
Filed as Exhibit 10.61 to the Current Report on Form 8-K. |
August 30, 2011 |
||||
|
|
|
Incorporated herein by reference to the following filings: | |||||
|---|---|---|---|---|---|---|---|
| Exhibit Number |
|
||||||
| Description | Form | Filed on | |||||
| 10.63 | + | Amended and Restated 2006 Equity Incentive Plan. | Filed as Exhibit 10.63 to the Annual Filing on Form 10-K for the fiscal year ended 2011. | March 12, 2012 | |||
|
10.64 |
+ |
Amended and Restated 2006 Equity Incentive PlanForm of Notice of Stock Unit Award and Stock Unit Agreement. |
Filed as Exhibit 10.64 to the Annual Filing on Form 10-K for the fiscal year ended 2011. |
March 12, 2012 |
|||
|
10.65 |
+ |
First Amendment to Amended and Restated Employment Agreement dated February 17, 2012, between the Registrant and Andrew J. Littlefair. |
Filed as Exhibit 10.65 to the Quarterly Report on Form 10-Q for the quarter ended March 31, 2012. |
May 7, 2012 |
|||
|
10.66 |
+ |
First Amendment to Amended and Restated Employment Agreement dated February 17, 2012, between the Registrant and Richard R. Wheeler. |
Filed as Exhibit 10.66 to the Quarterly Report on Form 10-Q for the quarter ended March 31, 2012. |
May 7, 2012 |
|||
|
10.67 |
+ |
First Amendment to Amended and Restated Employment Agreement dated February 17, 2012, between the Registrant and Mitchell W. Pratt. |
Filed as Exhibit 10.67 to the Quarterly Report on Form 10-Q for the quarter ended March 31, 2012. |
May 7, 2012 |
|||
|
10.68 |
+ |
First Amendment to Amended and Restated Employment Agreement dated February 17, 2012, between the Registrant and James N. Harger. |
Filed as Exhibit 10.68 to the Quarterly Report on Form 10-Q for the quarter ended March 31, 2012. |
May 7, 2012 |
|||
|
10.69 |
+ |
First Amendment to Employment Agreement dated February 17, 2012, between the Registrant and Barclay F. Corbus. |
Filed as Exhibit 10.69 to the Quarterly Report on Form 10-Q for the quarter ended March 31, 2012. |
May 7, 2012 |
|||
|
10.70 |
Credit Agreement dated November 7, 2012, among Clean Energy Tranche A LNG Plant, LLC and Clean Energy Tranche B LNG Plant, LLC, as Borrowers, the Various Financial Institutions from Time to Time Party thereto, as Lenders, and General Electric Capital Corporation, as Administrative Agent and Collateral Agent. |
Filed as Exhibit 10.70 to the Current Report on Form 8-K. |
November 13, 2012 |
||||
|
10.71 |
|
Guaranty dated November 7, 2012, issued by the Registrant to General Electric Capital Corporation. |
Filed as Exhibit 10.71 to the Annual Report on Form 10-K for the year ended December 31, 2012. |
February 28, 2013 |
|||
|
|
|
Incorporated herein by reference to the following filings: | |||||
|---|---|---|---|---|---|---|---|
| Exhibit Number |
|
||||||
| Description | Form | Filed on | |||||
| 10.72 | Equity Contribution Agreement dated November 7, 2012, among Clean Energy Tranche A LNG Plant, LLC and Clean Energy Tranche B LNG Plant, LLC, as Borrowers, the Registrant, as Equity Investor, and General Electric Capital Corporation, as Administrative Agent and Collateral Agent. | Filed as Exhibit 10.72 to the Current Report on Form 8-K. | November 13, 2012 | ||||
|
10.73 |
Warrant Agreement dated November 7, 2012, between the Registrant and GE Energy Financial Services, Inc. |
Filed as Exhibit 10.73 to the Current Report on Form 8-K. |
November 13, 2012 |
||||
|
10.74 |
Registration Rights Agreement dated November 7, 2012, between the Registrant and GE Energy Financial Services, Inc. |
Filed as Exhibit 10.74 to the Current Report on Form 8-K. |
November 13, 2012 |
||||
|
10.75 |
+ |
Second Amendment to Amended and Restated Employment Agreement dated December 12, 2012, between the Registrant and Andrew J. Littlefair. |
Filed as Exhibit 10.75 to the Annual Report on Form 10-K for the year ended December 31, 2012. |
February 28, 2013 |
|||
|
10.76 |
+ |
Second Amendment to Amended and Restated Employment Agreement dated December 12, 2012, between the Registrant and Richard R. Wheeler. |
Filed as Exhibit 10.76 to the Annual Report on Form 10-K for the year ended December 31, 2012. |
February 28, 2013 |
|||
|
10.77 |
+ |
Second Amendment to Amended and Restated Employment Agreement dated December 12, 2012, between the Registrant and Mitchell W. Pratt. |
Filed as Exhibit 10.77 to the Annual Report on Form 10-K for the year ended December 31, 2012. |
February 28, 2013 |
|||
|
10.78 |
+ |
Second Amendment to Amended and Restated Employment Agreement dated December 12, 2012, between the Registrant and James N. Harger. |
Filed as Exhibit 10.78 to the Annual Report on Form 10-K for the year ended December 31, 2012. |
February 28, 2013 |
|||
|
10.79 |
+ |
Second Amendment to Employment Agreement dated December 12, 2012, between the Registrant and Barclay F. Corbus. |
Filed as Exhibit 10.79 to the Annual Report on Form 10-K for the year ended December 31, 2012. |
February 28, 2013 |
|||
|
10.80 |
Lease dated March 18, 2013, between The Irvine Company LLC and Clean Energy. |
Filed as Exhibit 10.80 to the Quarterly Report on Form 10-Q for the quarter ended March 31, 2013. |
May 8, 2013 |
||||
|
|
|
Incorporated herein by reference to the following filings: | |||||
|---|---|---|---|---|---|---|---|
| Exhibit Number |
|
||||||
| Description | Form | Filed on | |||||
| 10.81 | First Amendment to Lease dated April 17, 2013, between The Irvine Company LLC and Clean Energy. | Filed as Exhibit 10.81 to the Quarterly Report on Form 10-Q for the quarter ended March 31, 2013. | May 8, 2013 | ||||
|
10.82 |
Note Purchase Agreement dated April 25, 2013, between Mavrix, LLC and Massachusetts Mutual Life Insurance Company |
Filed as Exhibit 10.82 to the Current Report on Form 8-K |
April 26, 2013 |
||||
|
10.83 |
Note Purchase Agreement dated June 14, 2013, among the Registrant, Chesapeake NG Ventures Corporation, Boone Pickens and Green Energy Investment Holdings, LLC. |
Filed as Exhibit 10.83 to the Current Report on Form 8-K. |
June 18, 2013 |
||||
|
10.84 |
Loan Agreement dated June 14, 2013, between the Registrant and Green Energy Investment Holdings, LLC. |
Filed as Exhibit 10.84 to the Current Report on Form 8-K. |
June 18, 2013 |
||||
|
10.85 |
Loan Agreement dated June 14, 2013, between the Registrant and Boone Pickens. |
Filed as Exhibit 10.85 to the Current Report on Form 8-K. |
June 18, 2013 |
||||
|
10.86 |
Registration Rights Agreement dated June 14, 2013, among the Registrant, Boone Pickens and Green Energy Investment Holdings, LLC. |
Filed as Exhibit 10.86 to the Current Report on Form 8-K. |
June 18, 2013 |
||||
|
10.87 |
Marketing Agreement dated June 28, 2013, among Clean Energy, Westport Power Inc. and Westport Fuel Systems Inc. |
Filed as Exhibit 10.87 to the Current Report on Form 8-K. |
June 28, 2013 |
||||
|
10.88 |
Registration Rights Agreement dated June 28, 2013, between Clean Energy and Westport Innovations Inc. |
Filed as Exhibit 10.88 to the Current Report on Form 8-K. |
June 28, 2013 |
||||
|
10.89 |
+ |
Third Amendment to Amended and Restated Employment Agreement dated May 6, 2013, between the Registrant and James N. Harger. |
Filed as Exhibit 10.89 to the Quarterly Report on Form 10-Q for the quarter ended June 30, 2013. |
August 8, 2013 |
|||
|
10.90 |
+ |
Clean Energy Fuels Corp. Employee Stock Purchase Plan. |
Filed as Exhibit Annex A to Schedule 14A Definitive Proxy Statement. |
March 28, 2013 |
|||
|
10.91 |
+ |
Clean Energy Renewable Fuels, LLC Unit Option Plan, Form of Notice of Option Award and Option Agreement. |
Filed as Exhibit 10.91 to the Quarterly Report on Form 10-Q for the quarter ended September 30, 2013. |
November 7, 2013 |
|||
|
|
|
Incorporated herein by reference to the following filings: | |||||
|---|---|---|---|---|---|---|---|
| Exhibit Number |
|
||||||
| Description | Form | Filed on | |||||
| 10.92 | | Liquefied Natural Gas Fueling Station and LNG Master Sales Agreement dated August 2, 2010, between Clean Energy and Pilot Travel Centers, LLC. | Filed as Exhibit 10.92 to the Annual Report on Form 10-K for the year ended December 31, 2013. | February 27, 2014 | |||
|
10.93 |
Loan Agreement dated March 1, 2014, between Canton Renewables, LLC and Michigan Strategic Fund. |
Filed as Exhibit 10.93 to the Current Report on Form 8-K. |
March 21, 2014 |
||||
|
10.94 |
Form of Common Unit Purchase Agreement dated October 14, 2014, among NG Advantage, LLC, Clean Energy and the other investors named therein. |
Filed as Exhibit 10.94 to the Company's Current Report on Form 8-K. |
October 15, 2014 |
||||
|
10.95 |
Purchase Agreement dated October 14, 2014, between Clean Energy and NG Advantage, LLC. |
Filed as Exhibit 10.95 to the Company's Current Report on Form 8-K. |
October 15, 2014 |
||||
|
10.96 |
Lease dated October 14, 2014, between Clean Energy and NG Advantage, LLC. |
Filed as Exhibit 10.96 to the Company's Current Report on Form 8-K. |
October 15, 2014 |
||||
|
10.97 |
Amendment to Credit Agreement dated December 29, 2014, among Clean Energy Tranche A LNG Plant, LLC, Clean Energy Tranche B LNG Plant, LLC and General Electric Capital Corporation. |
Filed as Exhibit 10.97 to the Company's Current Report on Form 8-K. |
January 5, 2015 |
||||
|
10.98 |
+* |
Separation Agreement and Release dated November 3, 2014, between the Registrant and Richard R. Wheeler. |
|
|
|||
|
10.99 |
+* |
Retirement Agreement dated December 29, 2014, between the Registrant and James N. Harger. |
|
|
|||
|
10.100 |
+* |
Offer Letter dated December 29, 2014, between the Registrant and James N. Harger. |
|
|
|||
|
10.101 |
+* |
Offer Letter dated October 28, 2014, between the Registrant and Robert M. Vreeland. |
|
|
|||
|
21.1 |
* |
Subsidiaries. |
|
|
|||
|
23.1 |
* |
Consent of Independent Registered Public Accounting Firm KPMG LLP. |
|
|
|||
|
|
|
Incorporated herein by reference to the following filings: | |||||
|---|---|---|---|---|---|---|---|
| Exhibit Number |
|
||||||
| Description | Form | Filed on | |||||
| 31.1 | * | Certification of Andrew J. Littlefair, President and Chief Executive Officer, pursuant to Rule 13a-14(a) or 15d-14(a) of the Securities and Exchange Act of 1934, as adopted pursuant to Section 302 of the Sarbanes-Oxley Act of 2002. | |||||
|
31.2 |
* |
Certification of Robert M. Vreeland, Chief Financial Officer, pursuant to Rule 13a-14(a) or 15d-14(a) of the Securities and Exchange Act of 1934, as adopted pursuant to Section 302 of the Sarbanes-Oxley Act of 2002. |
|
|
|||
|
32.1 |
** |
Certification pursuant to 18 U.S.C. Section 1350, as adopted pursuant to Section 906 of the Sarbanes-Oxley Act of 2002, executed by Andrew J. Littlefair, President and Chief Executive Officer, and Robert M. Vreeland Chief Financial Officer. |
|
|
|||
|
99.1 |
Natural Gas Hedge Policy dated May 29, 2008. |
Filed as Exhibit 99.1 to the Current Report on Form 8-K. |
June 20, 2008 |
||||
|
101 |
The following materials from the Company's Annual Report on Form 10-K for the year ended December 31, 2014, formatted in XBRL (eXtensible Business Reporting Language): |
|
|
||||
|
(i) Consolidated Balance Sheets; |
|
|
|||||
|
(ii) Consolidated Statements of Operations; |
|
|
|||||
|
(iii) Consolidated Statements of Comprehensive Income (Loss); |
|
|
|||||
|
(iv) Consolidated Statements of Stockholders' Equity; |
|
|
|||||
|
(v) Consolidated Statements of Cash Flows; and |
|
|
|||||
|
(vi) Notes to Consolidated Financial Statements. |
|
|
|||||
-
- Portions
of this exhibit have been omitted pursuant to the grant of a request for confidential treatment and the non-public information has been
filed separately with the SEC.
- *
- Filed
herewith.
- **
- Furnished
herewith.
- +
- Management contract or compensatory plan or arrangement.