10-K: Annual report pursuant to Section 13 and 15(d)
Published on February 24, 2025
UNITED STATES SECURITIES AND EXCHANGE COMMISSION
Washington, D.C. 20549
FORM
(Mark One) |
|
ANNUAL REPORT PURSUANT TO SECTION 13 OR 15(d) OF THE SECURITIES EXCHANGE ACT OF 1934 |
|
For the fiscal year ended: | |
or | |
TRANSITION REPORT PURSUANT TO SECTION 13 OR 15(d) OF THE SECURITIES EXCHANGE ACT OF 1934 |
|
For the transition period from to | |
Commission File Number:
(Exact name of registrant as specified in its charter)
|
||
(State or other jurisdiction of incorporation or organization) |
(IRS Employer Identification No.) |
(Address of principal executive offices, including zip code)
(
(Registrant’s telephone number, including area code)
Securities registered pursuant to Section 12(b) of the Act:
Securities registered pursuant to section 12(g) of the Act: None
Indicate by check mark if the registrant is a well-known seasoned issuer, as defined in Rule 405 of the Securities Act.
Indicate by check mark if the registrant is not required to file reports pursuant to Section 13 or Section 15(d) of the Act. Yes ☐
Indicate by check mark whether the registrant (1) has filed all reports required to be filed by Section 13 or 15(d) of the Securities Exchange Act of 1934 during the preceding 12 months (or for such shorter period that the registrant was required to file such reports), and (2) has been subject to such filing requirements for the past 90 days.
Indicate by check mark whether the registrant has submitted electronically every Interactive Data File required to be submitted pursuant to Rule 405 of Regulation S-T (§232.405 of this chapter) during the preceding 12 months (or for such shorter period that the registrant was required to submit such files).
Indicate by check mark whether the registrant is a large accelerated filer, an accelerated filer, a non-accelerated filer, a smaller reporting company, or an emerging growth company. See the definitions of “large accelerated filer,” “accelerated filer,” “smaller reporting company,” and “emerging growth company” in Rule 12b-2 of the Exchange Act.
Large accelerated filer ☐ |
|
|
Non-accelerated filer ☐ |
|
Smaller reporting company |
|
Emerging growth company |
If an emerging growth company, indicate by check mark if the registrant has elected not to use the extended transition period for complying with any new or revised financial accounting standards provided pursuant to Section 13(a) of the Exchange Act. ☐
Indicate by check mark whether the registrant has filed a report on and attestation to its management’s assessment of the effectiveness of its internal control over financial reporting under Section 404(b) of the Sarbanes Oxley Act (15 U.S.C. 7262(b)) by the registered public accounting firm that prepared or issued its audit report.
If securities are registered pursuant to Section 12(b) of the Act, indicate by check mark whether the financial statements of the registrant included in the filing reflect the correction of an error to previously issued financial statements.
Indicate by check mark whether any of those error corrections are restatements that required a recovery analysis of incentive-based compensation received by any of the registrant’s executive officers during the relevant recovery period pursuant to §240.10D-1(b). ☐
Indicate by check mark whether the registrant is a shell company (as defined in Rule 12b-2 of the Act). Yes
The aggregate market value of the voting stock held by non-affiliates of the registrant as of June 30, 2024, the last business day of the registrant’s most recently completed second fiscal quarter, was approximately $
As of February 14, 2025, there were
DOCUMENTS INCORPORATED BY REFERENCE
Portions of the registrant’s definitive proxy statement for its 2024 annual meeting of stockholders are incorporated by reference in Part III of this report.
Clean Energy Fuels Corp.
Annual Report on Form 10-K
For the Fiscal Year Ended December 31, 2024
TABLE OF CONTENTS
|
|
|
Page |
2 |
|||
3 |
|||
3 |
|||
17 |
|||
31 |
|||
31 |
|||
32 |
|||
32 |
|||
32 |
|||
33 |
|||
33 |
|||
34 |
|||
Management’s Discussion and Analysis of Financial Condition and Results of Operations |
34 |
||
52 |
|||
53 |
|||
Changes in and Disagreements with Accountants on Accounting and Financial Disclosure |
111 |
||
111 |
|||
111 |
|||
Disclosure Regarding Foreign Jurisdictions that Prevent Inspections |
111 |
||
|
|
112 |
||
112 |
|||
112 |
|||
Security Ownership of Certain Beneficial Owners and Management and Related Stockholder Matters |
112 |
||
Certain Relationships and Related Transactions, and Director Independence |
112 |
||
112 |
|||
|
|
|
|
113 |
|||
113 |
|||
113 |
|||
1
CAUTIONARY NOTE REGARDING FORWARD-LOOKING STATEMENTS
This annual report on Form 10-K (“this report”) contains “forward-looking statements” within the meaning of Section 27A of the Securities Act of 1933, as amended (the “Securities Act”), and Section 21E of the Securities Exchange Act of 1934, as amended (the “Exchange Act”). Forward-looking statements are statements other than historical facts. These statements relate to future events or circumstances or our future performance, and they are based on our current assumptions, expectations and beliefs concerning future developments and their potential effect on our business. In some cases, you can identify forward-looking statements by the following words: “if,” “may,” “might,” “shall,” “will,” “can,” “could,” “would,” “should,” “expect,” “intend,” “plan,” “goal,” “objective,” “initiative,” “anticipate,” “believe,” “estimate,” “predict,” “project,” “forecast,” “potential,” “continue,” “ongoing” or the negative of these terms or other comparable terminology. The absence of these words, however, does not mean that a statement is not forward-looking. The forward-looking statements we make in this report include statements about, among other things, our future financial and operating performance, our growth strategies, including expectations regarding our delivery and sales of RNG (as defined below), station construction and development, our California Fleet Fund, and sale of U.S. federal, state and local government credits, and anticipated trends in our industry and our business.
The preceding list is not intended to be an exhaustive list of all of the topics addressed by our forward-looking statements. Although the forward-looking statements we make reflect our good faith judgment based on available information, they are only predictions of future events and conditions. Accordingly, our forward-looking statements involve known and unknown risks, uncertainties and other factors that may cause our or our industry’s actual results, levels of activity, performance or achievements to be materially different from any future results, levels of activity, performance or achievements expressed or implied by our forward-looking statements. Factors that might cause or contribute to such differences include, among others, those discussed in Item 1A. Risk Factors of this report, as such factors may be amended, supplemented or superseded from time to time by other reports we file with the Securities and Exchange Commission (the “SEC”). In addition, we operate in a competitive and rapidly evolving industry in which new risks emerge from time to time, and it is not possible for us to predict all of the risks we may face. Nor can we assess the impact of all factors on our business or the extent to which any factor or combination of factors could cause actual results to differ from our expectations. As a result of these and other potential risks and uncertainties, our forward-looking statements should not be relied on or viewed as guarantees of future events or conditions.
All of our forward-looking statements in this report are made only as of the date of this report and, except as required by law, we undertake no obligation to update publicly any forward-looking statements for any reason, including to conform these statements to actual results or to changes in our expectations. You should, however, review the factors and risks we describe in the reports we will file from time to time with the SEC for the most recent information about our forward-looking statements and the risks and uncertainties related to these statements.
We qualify all of our forward-looking statements by this cautionary note.
* * * * * * *
Unless the context indicates otherwise, all references to “Clean Energy,” the “Company,” “we,” “us,” or “our” in this report refer to Clean Energy Fuels Corp., together with its majority and wholly owned subsidiaries.
We own registered or unregistered trademark or service mark rights to Clean Energy™ and Clean Energy Renewables™. Although we do not use the “®” or “™” symbol in each instance in which one of our trademarks appears in this report, this should not be construed as any indication that we will not assert our rights thereto to the fullest extent under applicable law. Any other service marks, trademarks and trade names appearing in this report are the property of their respective owners.
Investors and others should note that we disseminate information to the public about our Company, our products, services and other matters through various channels, including our website (www.cleanenergyfuels.com), SEC filings, press releases, public conference calls and webcasts, in order to achieve broad, non-exclusionary distribution of information to the public. We encourage investors and others to review the information we make public through these channels, as such information could be deemed to be material information.
2
PART I
Item 1. Business.
Overview
Clean Energy Fuels Corp., a Delaware corporation, is a leading renewable energy company focused on the procurement and distribution of renewable natural gas (“RNG”) and conventional natural gas, in the form of compressed natural gas (“CNG”) and liquefied natural gas (“LNG”), for the United States (“U.S.”) and Canadian transportation markets. RNG, which is delivered as either CNG or LNG, is created by the recovery and processing of naturally occurring, environmentally detrimental waste methane (“biogas”) from non-fossil fuel sources – such as dairy and other livestock waste and landfills – for environmentally beneficial use as a replacement for fossil-based transportation fuels at an affordable price. Methane is one of the most potent climate-harming greenhouse gases (“GHG”) with a comparative impact on global warming that is about 28 times more powerful than that of carbon dioxide. We are focused on developing, owning, and operating dairy and other livestock waste RNG projects and supplying RNG (currently procured from third party sources and from our anaerobic digester gas (“ADG”) RNG joint venture project with TotalEnergies S.E. (the “DR JV”) (see Note 3)) to our customers in the heavy and medium-duty commercial transportation sectors. We have participated in the alternative vehicle fuels industry for over 20 years. We believe we are in a unique position because the valuable Environmental Credits (as defined below) are generated by the party that dispenses RNG into vehicle fuel tanks, and we believe we have access to more dispensers than any other market participant.
We believe we were the first organization to sell RNG as a vehicle fuel in the U.S., and sales of our RNG for such purpose have increased from 13.0 million gasoline gallon equivalents (“GGEs”) in 2013 to 236.7 million GGEs in 2024. We calculate one GGE to equal 125,000 British Thermal Units (“BTUs”) and, as such, one million BTUs (“MMBTU”) equals eight GGEs. We are North America’s leading provider of the cleanest fuel for the commercial transportation market, based on both the number of stations we operate and the amount of GGEs serviced and GGEs sold of RNG and conventional natural gas, in the form of CNG and LNG, which amounted to a total of 477.9 million GGEs in 2024. With the Company’s focus on RNG, our sales of RNG volume have grown from 12% of our vehicle fuel sales in 2013 to 89% of our vehicle fuel sales in 2024 (excluding GGEs from O&M (as defined below) services sales and non-vehicle sales). We believe that during 2024 we provided 50% and 39% of the RNG used for transportation fuel in California and the U.S., respectively.
As a comprehensive clean energy solutions provider, we also design and build, as well as operate and maintain (“O&M”), public and private vehicle fueling stations in the U.S. and Canada; sell and service compressors and other equipment used in RNG production and at fueling stations; transport and sell RNG and conventional natural gas via “virtual” natural gas pipelines and interconnects; sell U.S. federal, state and local government credits (collectively, “Environmental Credits”) we generate by selling RNG as a vehicle fuel, including Renewable Identification Numbers (“RIN Credits” or “RINs”) under the federal Renewable Fuel Standard Phase 2 and credits under the California, Oregon, and Washington Low Carbon Fuel Standards (collectively, “LCFS Credits”); and obtain federal, state and local tax credits, grants and incentives. We serve fleet vehicle operators in a variety of markets, including heavy-duty trucking, airports, refuse, public transit, industrial and institutional energy users, and government fleets. We believe these fleet markets will continue to present a growth opportunity for our vehicle fuels for the foreseeable future.
Commercial transportation, including heavy-duty trucking, generates a significant portion of the emissions of overall carbon dioxide and other climate-harming GHGs, and transitioning this sector to low and negative carbon fuels is a critical step towards reducing overall global GHG emissions. According to the Global Carbon Project’s Global Carbon Budget published in December 2024 and International Energy Agency’s topic analysis on transport, 37.0 billion metric tons of carbon dioxide were emitted globally in 2023, of which 8.0 billion metric tons, or 22%, came from the transportation sector. There is a global demand for reducing GHG emissions, as evidenced by 98% of the world’s countries having committed to the Paris Agreement according to The United Nations Framework Convention in Climate Change, and 98.6% of S&P 500 companies focusing on sustainability metrics, including GHG emissions, according to the Governance & Accountability Institute’s Flash Report published in 2024.
3
Biogas, the primary source of RNG, is produced by microbes as they break down organic matter in the absence of oxygen. Our sources of commercial scale biogas are ADG, which is produced inside an airtight tank used to breakdown organic matter such as dairy and other livestock waste, and landfill gas (“LFG”), which is produced by the decomposition of organic waste at landfills.
Given the potential growth and positive environmental impact of RNG, our mission is to secure and sell as much RNG supply as possible. To that end we are pursuing development and ownership of dairy and other livestock waste ADG projects on our own and with partners including TotalEnergies S.E. (“TotalEnergies”) and BP Products North America (“bp”). Further, we enter long-term RNG supply offtake agreements with well-known third parties that own RNG production facilities. Because our business transforms waste methane into a renewable source of energy, our RNG generates valuable Environmental Credits under federal and state initiatives.
Depending on the source, the California Air Resources Board (“CARB”) has determined that RNG can have a significantly negative carbon intensity score, enabling our customers to achieve a net carbon negative emissions profile.
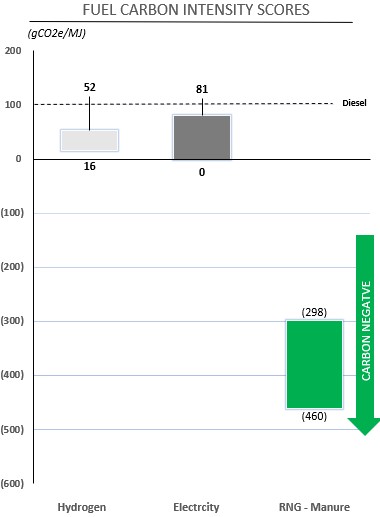
California Air Resources Board “Current Fuel Pathways” Q2 2021 to Q3 2024
At present, we see the best use of RNG as a replacement for fossil-based fuel in the transportation sector. We believe the most attractive market for RNG is U.S. heavy-duty Class 8 trucking and, based on information from the American Trucking Association and our own internal estimates, we believe there are approximately 4.1 million Class 8 heavy-duty trucks operating in the U.S. that use over 40 billion gallons of fuel per year. As of December 31, 2024, we deliver RNG to the transportation market through 582 fueling stations we own, operate or supply in 43 states and the District of Columbia in the U.S., including over 200 stations in California. We also own, operate, or supply 25 fueling stations in Canada as of December 31, 2024. Critically, to generate valuable Environmental Credits, the RNG must be placed in vehicle fuel tanks. We believe our stations and customer relationships allow us to sell substantially more RNG to vehicle operators than any other participant in the market – we calculate that we have access to more fueling stations and vehicle fleets than all our competitors combined. As of December 31, 2024, we served over 1,000 fleet customers operating over 50,000 vehicles on our fuels. We believe we are the only company in the U.S. that provides RNG vehicle fuel at scale in California and nationally.
4
Recently, we have expanded our offering to include hydrogen fuel for vehicle fleets and have won multiple competitive bids to build hydrogen stations for California transit agencies. As more operators deploy hydrogen powered vehicles, we can modify our fueling stations to reform our RNG and deliver clean hydrogen to customers. We also believe our RNG can be used to generate clean electricity to power electric vehicles, and we have the capability to add electric vehicle charging at our station sites, although the cost of adding electric vehicle charging capacity may be significant.
Our Principal Products, Services and Other Business Activities
Our principal products, services and other business activities are described below. Information about the revenue we receive from these activities is discussed in this report in Item 7. “Management’s Discussion and Analysis of Financial Condition and Results of Operations.”
Fuel Sales
We sell RNG and conventional natural gas, in the form of CNG and LNG, as fuel for medium and heavy-duty vehicles.
| ● | RNG is injected into natural gas pipelines, which allows RNG to be transported to vehicle fueling stations where it can be compressed and dispensed as CNG, and to liquefaction facilities where it is liquified and made into LNG. We source RNG from the DR JV, one of our jointly owned RNG production facilities, and purchase RNG from bp and other third-party producers, comprising over 150 supply sources, typically under long-term RNG supply offtake agreements. In exchange for the agreement to offtake RNG supply, we and the supplier negotiate to determine what percentage share of the value of the Environmental Credit each party will retain. The value of the Environmental Credit is based on the realized value after the credit is sold to (purchased by) an obligated party or as agreed by the supplier and us as part of the negotiation. Our supply offtake agreements are variable and are based on actual RNG produced by the third-party producers, up to various maximum volume levels as governed by the arrangement. In 2024, our third-party sourced RNG consisted of 34% ADG and 66% LFG. |
Conventional natural gas is typically sourced from local utilities or third-party conventional natural gas marketers. We purchase conventional natural gas under North American Energy Standards Board base contracts on a spot market or short-term forward index basis or forward purchase contracts under take-or-pay arrangements that require us to purchase minimum volumes of conventional natural gas. Conventional natural gas is purchased on a normal purchase normal sale basis, as the conventional natural gas we purchase is for physical delivery of the commodity to our fueling stations for sale to customers.
| ● | CNG is RNG or conventional natural gas that is compressed and dispensed in gaseous form. CNG is typically sold by obtaining RNG from our own RNG production facilities, third-party RNG suppliers or third-party RNG marketers or conventional natural gas from local utilities or third-party conventional natural gas marketers, compressing and storing it at a fueling station, and dispensing it directly into a vehicle. Our CNG vehicle fuel sales are primarily made through contracts with our customers or on a per fill-up basis at prices we set at public access fueling stations based on prevailing market conditions. Through our subsidiary NG Advantage, LLC (“NG Advantage”), we also transport and sell CNG for non-vehicle purposes via virtual natural gas pipelines and interconnects to industrial and institutional energy users that do not have direct access to natural gas pipelines. NG Advantage also has the capability to transport CNG from production facilities to pipeline injection sites using its fleet of 96 high-capacity trailers. |
| ● | LNG is RNG or conventional natural gas that is cooled at a liquefaction facility to approximately negative 260 degrees Fahrenheit until it condenses into a liquid. We obtain LNG from our own liquefaction plants and from third-party suppliers. For LNG obtained from our own liquefaction plants, we supply the RNG, sourced from our own RNG production facilities, third-party RNG suppliers or third-party RNG marketers, or conventional natural gas, sourced from local utilities or third-party conventional natural gas marketers, to our liquefaction plants. We own and operate LNG liquefaction plants near Boron, California and Houston, Texas, which we refer to as the “Boron Plant” and the “Pickens Plant,” respectively. The Boron Plant can produce 98.5 million gallons of LNG per year and has a dual tanker trailer loading system and a 1.8 million |
5
| gallon storage tank that can hold up to 1.5 million usable gallons. The Pickens Plant can produce 36.5 million gallons of LNG per year and includes a tanker trailer loading system and a storage tank that can hold up to 830,000 usable gallons. In 2024, we produced 93% of our LNG at our plants and purchased the remainder of our LNG from third-party suppliers. We sell LNG for use as a vehicle fuel on a bulk basis to fleet customers and through our network of public access fueling stations. We deliver LNG with our fleet of 74 tanker trailers to fueling stations, where it is stored and then dispensed in liquid form into vehicles. The need to liquefy and transport LNG generally causes LNG to cost more than CNG. We sell LNG through supply contracts and on a per fill-up basis at prices we set at public access fueling stations based on prevailing market conditions. Additionally, we sell LNG for non-vehicle purposes, including to customers who use LNG in rocket propulsion and oil fields, and for utility, industrial, marine and rail applications. |
Sales of Environmental Credits. We generate Environmental Credits consisting of RINs and LCFS Credits when we sell RNG for use as a vehicle fuel in the U.S. We sell these Environmental Credits to third parties who must comply with federal and state emissions requirements. Generally, the number of Environmental Credits we generate increases as we sell higher volumes of RNG as a vehicle fuel. The number of Environmental Credits we sell and our revenue from these sales can vary depending on a number of factors, including the market for these credits, which has been volatile and subject to significant price fluctuations in recent periods (for example, in 2024, market prices for RINs were as high as $3.57 and as low as $2.08 and market prices for LCFS Credits were as high as $78.50 and low as $40.00), any changes to the federal and state programs under which the credits are generated and sold, and our ability to strictly comply with these programs.
O&M Services. We perform maintenance service on Clean Energy-owned and customer-owned fueling stations. Our maintenance program is backed by over 200 company employed service technicians and support personnel, an in-house 24/7 remote monitoring center, technician training center, computerized maintenance management system and inventory warehouses throughout the U.S. and Canada. For maintenance services, we generally charge a fixed fee or per gallon fee based on volume of fuel dispensed at the station.
Station Construction and Engineering. We design and construct fueling stations and sell or lease some of these stations to our customers. Since 2008, we have served as the general contractor or supervised qualified third-party contractors to build over 470 natural gas fueling stations.
Grant Programs. We apply for and help our fleet customers apply for federal, state and local grant programs in areas in which we operate. These programs can provide funding for vehicle purchases, fueling station construction and vehicle fuel sales.
Our Company’s Sustainability Program
Our vision is to deliver renewable transportation fuel for a cleaner, safer, more equitable tomorrow. We have a bold program, supported by ambitious goals to drive progress across four key pillars: fueling the transition to renewable energy in transportation, building the workforce for the future of renewable energy, advancing smart policies that drive the transformation to zero carbon fuels, and earning stakeholder trust.
Fueling transportation’s transition to renewable energy.
The fuel we provide enables our customers to transition from diesel to a solution with significantly lower GHG emissions and air quality impacts today. We are committed to pushing ourselves and our partners further by helping to produce and distribute 100% RNG, which can have a low carbon profile. We are also committed to doing our part to reduce our own emissions across our operations and supply chain.
Building the workforce for the future of renewable energy.
At Clean Energy we have always had a strong focus on employee and contractor safety and strive to be a zero-incident workplace for our service technicians and staff, as well as our customers using our facilities. Looking towards the future, we will continue to focus on employee recruitment, retention, and engagement. It is important that we build a leadership team and supplier base that are reflective of the communities in which we operate.
6
Advancing smart policies that drive the transformation to zero carbon fuels.
Widespread change will be necessary across all industries to achieve our collective climate goals while maintaining a vibrant economy. We recognize that some physical climate impacts are unavoidable in the near-term and that the transition to a low carbon economy may bring new risks to our business. We also recognize that natural gas extraction and processing causes environmental and social impacts that must be appropriately managed. By investing in the energy transition, our aim is to reduce our own risks and provide lasting benefits to society. To enable lasting change, we must ensure the adoption of performance-driven state and federal policies that accelerate the shift from diesel and other transportation fuels with high GHG emissions and negative air quality impacts to zero net carbon emission transportation fuels. We are also committed to contributing to quality of life improvement and economic development in the communities where we conduct business, many of which are disadvantaged communities that suffer from poor air quality due to the use of transportation fuels, including diesel, that have high GHG emissions and significantly negative air quality impacts.
Earn stakeholder trust.
To realize our ambitious goals we are building trusted partnerships with our stakeholders. We strive to act ethically and responsibly in all aspects of our business, seeking to meet expectations related to human rights, labor standards, air quality, water stewardship, operational energy efficiency, biodiversity and land use, disaster preparedness, business ethics, and other material topics.
Market Opportunity
Increasing demand for RNG
Demand for RNG produced from biogas is significant and growing in large part due to an increased focus by the U.S. public and investors, as well as federal, state, and local regulatory authorities, on reducing the emission of GHG, such as methane. According to the U.S. Environmental Protection Agency (“EPA”), methane is a significant GHG, which accounted for roughly 12% of all U.S. GHG emissions from human activities in 2022 and which has a comparative impact on global warming that is about 28 times more powerful than that of carbon dioxide over a 100-year period. Biogas processing facilities substantially reduce methane emissions at livestock farms and landfills, which together accounted for approximately 41% of U.S. methane emissions in 2022 according to the EPA.
Over the past decade we have seen the transportation sector be the fastest growing end market for RNG, where RNG is used as a replacement for fossil-based fuel. This growth has been principally driven by an increased focus on reducing GHGs, as well as Environmental Credits to support the production of renewable transportation fuels. According to The Transport Project, a national organization dedicated to the development of a growing, profitable, and sustainable market for vehicles powered by alternative fuels, in 2023, “RNG use as a transportation fuel increased 92% from 2019 levels, and RNG use as a motor fuel displaced 6.96 million metric tons of carbon dioxide equivalent.” Further, RNG engines now commercially available for heavy-duty, regional-haul, refuse, transit, and vocational applications have been certified to satisfy CARB’s optional low nitrogen oxide (“NOx”) emission standard of 0.02 g/bhp-hr. This means that these engines emit 90% less smog-forming NOx than the existing regulatory standards, making them the lowest certified ultra-low NOx emission engines in the U.S.
Given public and investor calls for, and U.S. federal, state, and local regulatory trends and policies aimed at, reducing GHG emissions, we expect continued regulatory support for RNG as a replacement for fossil-based fuels and therefore continued and growing demand for RNG in the foreseeable future.
Increasing vehicle availability
RNG is a replacement for fossil-based fuel consumed by vehicles that use internal combustion engines like those used in gasoline- or diesel-powered vehicles. Virtually any car, truck, bus, or other vehicle is capable of being manufactured to run on RNG. Many types and models of heavy- and medium-duty RNG vehicles and engines are available in the U.S., including, among others, long-haul tractors, refuse trucks, regional tractors, transit buses, ready-mix trucks, delivery trucks, vocational work trucks, school buses, shuttles, pickup trucks and cargo and passenger vans. Most notably,
7
Cummins, one of the largest engine manufacturers in the world, has recently brought to market the X15N, a 15-liter natural gas engine designed for the heavy-duty truck market.
More broadly, many companies are developing and commercializing hydrogen and electric commercial vehicles, particularly as the commercial transportation sector increasingly shifts toward low-emission, zero-emission, or carbon neutral vehicle solutions. Various manufacturers have announced their plans to bring long-haul Class 8 commercial hydrogen- and battery-powered vehicles to the market over the coming years.
Availability of long-term feedstock supply
Biogas is collected and processed to remove impurities for use as RNG and injected into existing natural gas pipelines. RNG is fully interchangeable with and chemically identical to conventional natural gas. Common sources of biogas include livestock farms, landfills, and wastewater resource recovery facilities.
Livestock- and landfill-sourced biogas represent a significant opportunity to produce RNG and reduce GHG emissions. Although LFG has accounted for most of the growth in biogas projects to date, biogas from dairy and other livestock farm waste represents significant opportunities for RNG production that remain largely untapped. According to ICF Consulting, Inc., the global consulting services company, by 2040, the U.S. has the technical potential to annually produce up to 34.4 billion GGEs of RNG, including up to 20.6 billion GGEs of ADG RNG.
All-in prices paid for RNG from livestock farms can be significantly higher than prices for RNG from landfills due to higher value available from state-level low-carbon fuel incentives for these projects. Given our market leadership in RNG, we believe we are well-positioned to take advantage of this market.
TotalEnergies Joint Venture
On March 3, 2021, we entered into an agreement (the “TotalEnergies JV Agreement”) with TotalEnergies to create 50-50 joint ventures to develop ADG RNG production facilities in the U.S. The TotalEnergies JV Agreement contemplates investing up to $400.0 million of equity in production projects, and TotalEnergies and the Company each committed to initially provide $50.0 million. Pursuant to the TotalEnergies JV Agreement, the Company and TotalEnergies have given each party a limited right of first opportunity to invest in ADG RNG projects they respectively originate. Currently, there is one ADG RNG joint venture project (the “DR JV”) in operation pursuant to the TotalEnergies JV Agreement. This project is estimated to produce up to 0.8 million GGEs of RNG annually, all of which is available to the Company for sale to the vehicle fuels market.
bp Joint Venture
On April 13, 2021, pursuant to a memorandum of understanding we entered into with bp in December 2020, we entered into an agreement (“bp JV Agreement”) with bp that created a 50-50 joint venture (the “bpJV”) to develop, own and operate new ADG RNG production facilities in the U.S. From inception to December 31, 2024, we and bp have collectively contributed approximately $455.5 million of equity to the bpJV. Currently, there are five ADG RNG projects in operation and one large ADG RNG project under construction, which is planned to be completed by the fourth quarter of 2025. Collectively, the six ADG RNG projects in the bpJV are currently estimated to produce up to 8.2 million GGEs of RNG annually, and 100% of the RNG produced from these projects will be available to us for sale as vehicle fuel pursuant to our existing marketing agreement with bp.
The Company’s RNG projects
As of December 31, 2024, we had three 100% owned ADG RNG projects under development, which are anticipated to be substantially complete between the second and third quarter of 2025. In accordance with the TotalEnergies JV Agreement, we will provide TotalEnergies with the right of first opportunity to invest in these ADG RNG projects alongside the Company. Collectively, our three 100% owned ADG RNG projects will have an estimated RNG production volume of 3.6 million GGEs per year, all of which will be available to us for sale to the vehicle fuels market.
8
Tourmaline Joint Development
On April 18, 2023, we and Tourmaline Oil Corp. (“Tourmaline”) announced a CAD $70 million Joint Development Agreement (“the Tourmaline JDA”) to build and operate a network of CNG stations along key highway corridors across Western Canada. Under a 50-50 shared investment, the construction of these CNG fueling stations will allow heavy-duty trucks and other commercial transportation fleets that operate in the area to transition to the use of CNG, a lower carbon and NOx alternative to gasoline and diesel. From inception to December 31, 2024, we and Tourmaline have collectively contributed approximately CAD$29.9 million of equity to the Tourmaline JDA. We are operating a CNG fueling station in Edmonton, Alberta, as part of the Tourmaline JDA and have since opened two more stations in the municipalities of Calgary and Grande Prairie in Alberta. We expect to open additional CNG fueling stations in Chilliwack and Kamloops in British Columbia and Fort McMurray in Alberta in 2025, with additional locations being evaluated.
Maas Energy Works, LLC Joint Development
On May 8, 2024, the Company entered into a joint development agreement (the “Maas JDA”) with Maas Energy Works, LLC (“Maas”), granting the Company exclusive right to acquire, fund and participate in the development of certain ADG RNG production projects at dairy farms subject to its due diligence. Pursuant to the Maas JDA, the Company will provide financing to fund the development, construction, operation and maintenance of approved ADG RNG production projects, and Maas will manage and oversee the development, construction, operations and maintenance of such approved projects. The Company will record all the associated income/loss in earnings until a certain rate of return is achieved and then receive 49% of the income/loss in earnings with Maas receiving 51%. The Company contemplates investing up to $132.0 million of equity capital in production projects in connection with the Maas joint development. RNG produced from projects developed and constructed in connection with the Maas joint development will be available to the Company for sale as vehicle fuel.
Pursuant to the Maas JDA, each approved ADG RNG production project will be formed as a separate, special purpose project limited liability company that will be wholly-owned by a holding company (collectively, the “Project LLC”), which is jointly controlled by Maas and the Company. The Company accounts for its interest in the Project LLC using the equity method of accounting because it has the ability to exercise significant influence but does not control the Project LLC’s operations. In the year ended December 31, 2024, the Project LLC issued capital calls totaling $32.6 million, which has been contributed by the Company. Proceeds of the capital calls will be used to develop and construct ADG RNG projects.
Use of environmental credits to promote RNG growth
When used as a transportation fuel, RNG generates additional revenue streams through Environmental Credits. These Environmental Credits are provided under a variety of programs, including the national Renewable Fuel Standards (“RFS”), and state-level Low Carbon Fuel Standard (“LCFS”) programs.
The RFS program requires transportation fuel to contain a minimum volume of renewable fuel. To fulfill this regulatory mandate, the EPA obligates refiners and importers (“Obligated Parties”) to blend renewable fuel with standard fuel to meet renewable volume obligations (“RVOs”). Obligated Parties can comply with RVOs by either blending RNG into their existing fuel supply or purchasing Renewable Identification Numbers, or RINs. RINs are generated when eligible renewable fuels are produced or imported and blended with a petroleum product for use as a transportation fuel. The RFS program has been a key driver of growth in the RNG industry since 2014 when the EPA ruled that RNG, when used as a transportation fuel, would qualify for D3 RINs (for cellulosic biofuels), which are generally the most valuable among the four categories of RINs. In 2024, we estimate that we generated 39% of all D3 RINs in the U.S.
The monetization of RNG also benefits from low-carbon fuel initiatives at the state-level, specifically from established programs in California, Oregon, New Mexico, and Washington. California’s LCFS (“CA LCFS”) program requires fuel producers and importers to reduce the carbon intensity (“CI”) of their products, with goals of a 10% reduction in carbon emissions from 1990 levels by 2020 and a 20% reduction by 2030. CARB awards CA LCFS credits to RNG projects based on each project’s CI score relative to the target CI score for gasoline and diesel fuels. The CI score represents the overall net impact of carbon emissions for each RNG pathway and is determined on a project-by-project basis. Because our business involves the capture and transformation of waste methane into a renewable source of energy, our customers are
9
able to significantly reduce, if not eliminate, GHG emissions from their commercial transportation activities. Further, CARB calculates RNG produced by livestock farms as carbon negative, generating substantial incremental CA LCFS credits. Multiple other states, including New York and Illinois are considering LCFS initiatives like those implemented in California, Oregon, New Mexico, and Washington. In 2024, we estimate that we generated 42% of all LCFS credits under Bio-CNG and Bio-LNG pathways in the CA LCFS.
Our Strategy
We aim to maintain and increase our position as the leading provider of RNG to the commercial vehicle market in North America, and our goal is to deliver 100% RNG to our entire fueling infrastructure. We support this objective through a multi-pronged strategy of:
| ● | promoting the adoption by fleets of the Cummins X15N natural gas engine; |
| ● | promoting the environmental and economic benefits of RNG for fleet vehicles; |
| ● | increasing supply of RNG through the development of new project investment opportunities, expanding our existing supplier portfolio, and leveraging our existing fuel network and customer relationships; |
| ● | empowering our customers to achieve their sustainability and carbon reduction objectives; |
| ● | leveraging our management expertise; and |
| ● | utilizing our environmental, health and safety and compliance leadership. |
Promoting the adoption by fleets of the Cummins X15N natural gas engine.
In 2024, Cummins Inc. released the anticipated X15N engine. The X15N engine is the first 15-liter natural gas engine to come to market, in the United States and Canada, and is expected to match the performance and reliability of its diesel counterpart. The X15N engine has power ratings up to 500hp, torque up to 1850 lb-ft, and a 700+ mile range and is designed to suit the needs of long-haul applications. We believe the adoption of the X15N engine by existing and prospective customers presents many opportunities for us and our existing network of natural gas fueling stations. We believe we are uniquely positioned to facilitate the adoption of the X15N engine, and increase the take-up of RNG as a fueling solution in the long-haul transportation space.
Promoting the environmental and economic benefits of RNG for fleet vehicles.
We believe that RNG has unique characteristics to both reduce harmful greenhouse gas emissions and be a fuel that can be priced less than incumbent fuels like diesel. Not only is RNG produced at dairies scored by CARB as having a much lower CI, but it also, on average, costs less per gallon than a gallon of diesel. By simultaneously replacing fossil-based fuels and reducing overall methane emissions, our business has a substantial positive environmental impact. In addition to its methane emission benefits, the increased production and use of RNG have several other environmental benefits. Anaerobically digested livestock waste produces significantly less odor than conventional storage and land application systems. The odor of stored livestock waste mainly comes from volatile organic acids and hydrogen sulfide, which has a “rotten egg” smell. In an anaerobic digester, volatile organic compounds are reduced to methane and carbon dioxide, which are odorless gases. The volatized fraction of hydrogen sulfide is captured with the collected ADG and destroyed. Anaerobic digestion provides several water quality and land conservation benefits as well. Digesters, particularly heated digesters, can destroy more than 90% of disease-causing bacteria that might otherwise enter surface waters and pose a risk to human and animal health. Digesters also reduce biochemical oxygen demand (“BOD”). BOD is one measure of the potential for organic wastes to reduce dissolved oxygen in natural waters. Because fish and other aquatic organisms need minimum levels of dissolved oxygen for survival, farm practices that reduce BOD protect the health of aquatic ecosystems. In addition to protecting local water resources, implementing anaerobic digesters on livestock facilities improves soil health. Adding digestate to soil increases the organic matter content, reduces the need for chemical fertilizers, improves plant growth and alleviates soil compaction. Further, digestion converts nutrients in manure to a more
10
accessible form for plants to use. The risks of water and soil contamination from flooding of open lagoons are also mitigated by digesters.
Increasing supply of RNG through the development of new project investment opportunities, expanding our existing supplier portfolio, and leveraging our extensive fueling station network and customer relationships.
In our view, the market has not yet unlocked the full potential of RNG. We believe we were the first company to deliver RNG to the commercial vehicle fuels market, have the most extensive RNG fueling infrastructure and customer relationships, and our stations and customer relationships allow us to obtain and deliver substantially more RNG to vehicle operators than any other participant in the market. This is important because RNG must be placed in vehicle fuel tanks to generate the valuable Environmental Credits.
Dependable and economic sources of RNG are critical to our success. We continue to leverage our relationships built over the past several decades to identify and execute new RNG project development and supply offtake opportunities. These come from our relationships with feedstock owners and project developers who value our long operating history, strong reputation in the industry and unmatched access to fueling infrastructure and vehicle operators for certainty of Environmental Credit generation. Based on the foregoing, we believe that we are presented with nearly every material development, supply and distribution opportunity in the market.
We exercise financial discipline in pursuing projects by targeting project returns that are in line with the relative risk of the specific projects and associated feedstock costs and any related attributes that can be monetized. We also support third parties that own RNG production facilities by entering into long-term RNG supply offtake agreements. As these facility owners expand their operations, we provide additional access to our fueling infrastructure and customer relationships.
As of December 31, 2024, we obtain RNG from over 150 supply sources. We believe that we have one of the largest and most diverse supply portfolios in the RNG industry, which allows us to provide certainty of RNG supply to our vehicle operator customers.
In our view, all the foregoing gives us a competitive advantage relative to existing and new market entrants.
Empowering our customers to achieve their sustainability and carbon reduction objectives.
We believe we are uniquely positioned to empower our customers to achieve their sustainability and carbon reduction goals and do it affordably. Because our business involves the capture and transformation of waste methane into a renewable source of energy, we believe our customers can significantly reduce, if not eliminate, GHG emissions from their commercial transportation activities. Further, our RNG is available today to reduce climate harming GHG and meet sustainability objectives and at a cost to customers that is very competitive to other fuels like diesel. We also assist our customers in their transition to cleaner transportation fuels by helping them obtain federal, state and local tax credits, grants and incentives, providing vehicle financing, including through multiple marketing and incentive programs, engineering and constructing fueling stations, and facilitating customer selection of vehicle specifications that best meet their needs.
Management expertise
Our management team has decades of combined experience in the alternative vehicle fueling industry. We believe our team’s proven track record in alternative vehicle fuels and focus on RNG gives us a strategic advantage in continuing to grow our business profitably. Our diverse experience and integration of key technical, environmental, and administrative support functions, along with our first-to-market advantage, further our ability to successfully deliver RNG to the commercial vehicle fuels market.
Environmental, health and safety and compliance leadership
Our executive team places the highest priority on the health and safety of our staff and third parties, as well as the preservation of the environment. Our corporate culture is built around supporting these priorities, as reflected in our well-established practices and policies. By setting and maintaining high standards in the renewable energy field, we are often
11
able to contribute positively to the safety practices and policies of our partners and customers. Our high safety standards include use of wireless gas monitoring safety devices, active monitoring of all field workers, performing environmental health and safety (“EHS”) audits and using technology throughout our safety processes from employee training in compliance with operational processes and procedures to emergency preparedness. By extension, we incorporate our EHS standards into our subcontractor selection qualifications to ensure that our commitment to high EHS standards is shared by our subcontractors. For 2024, our Total Recordable Incident Rate (“TRIR”) was 1.98, which is lower than the 2023 national average of 2.7 TRIR for all industries. As of December 31, 2024, we have not received any U.S. Occupational Health and Safety Administration (“OSHA”) or state OSHA citations in the last five years.
How We Generate Revenue
We generate revenue from selling RNG and conventional natural gas as a vehicle fuel, as well as by selling the associated Environmental Credits. RNG volume made up 89% of our vehicle fuel sales in 2024, and our goal is for 100% of our vehicle fuel sales to be RNG. Although RNG has the same chemical composition as natural gas from fossil sources, it has unique Environmental Credits assigned to it due to its origin from low- and negative-carbon, renewable sources. The Environmental Credits that we sell are composed of RINs and state low-carbon fuel credits, including CA LCFS credits, which are generated from the conversion of biogas to RNG that is used as a transportation fuel.
In addition to revenues generated from sales of RNG and conventional natural gas as a vehicle fuel and Environmental Credits, we also generate revenues by providing O&M services for public and private RNG, natural gas and hydrogen vehicle fleet customer stations; selling and servicing compressors and other equipment used in RNG production and at RNG, natural gas and hydrogen stations; and obtaining federal, state and local tax credits, grants and incentives.
We are experts in the engineering, design and construction of fueling stations. When we build stations for customers, we charge construction, other fees, or lease rates based on the size and complexity of the project. Since 2008, we have served as the general contractor or supervised qualified third-party contractors to build over 460 fueling stations.
| ● | Equipment for RNG stations consists of compressors, storage tanks, and dispensers. |
| ● | As operators deploy hydrogen-powered vehicles, we can modify our fueling stations and build additional stations to dispense clean hydrogen produced from our RNG. The equipment for hydrogen stations includes compressors, storage tanks, and dispensers, provided that the cost of adding hydrogen fueling may be significant. |
| ● | We also have the capability to add high speed level 3 electric vehicle charging at our station sites, and our RNG can be used as a clean resource to power electric vehicles via on-site generation and/or routing to the electric grid serving our stations, although the cost of adding electric vehicle charging capacity may be significant. |
Key Customer Markets
We serve customers in a variety of markets, including trucking, airports, refuse and public transit. We believe these customer markets are well-suited for the adoption of RNG and other alternative vehicle fuels because they consume relatively high volumes of fuel, refuel at centralized locations or along well-defined routes and/or are facing increasingly stringent emissions or other environmental requirements. During the years ended December 31, 2022, 2023 and 2024, zero, zero and one customer accounted for 10% or more of our total revenue, respectively.
Trucking
We believe heavy-duty trucking represents the greatest opportunity for the expansion of RNG fueling. We estimate there are approximately 4.1 million Class 8 heavy-duty trucks operating in the U.S. using over 40 billion gallons of fuel each year. Because these high-mileage vehicles consume substantial amounts of fuel, operators can derive significant benefits from the carbon and GHG reductions associated with our vehicle fuels, while doing it at competitive costs versus diesel. We are focused on fueling more heavy-duty trucks, and many well-known shippers, manufacturers, retailers and other truck fleet operators have started to use RNG fueled trucks to move their freight, including, among others, Amazon, Pepsi Frito-Lay, FedEx, Anheuser-Busch, USPS, UPS, Kroger, KeHe Distributors, Kenan Advantage Group, and Estes Express.
12
California RNG Fleet Fund
Clean Energy’s California Fleet Fund is an incentive program to help California fleets transition to RNG. Fleets can receive up to $50,000 for a Freightliner or Peterbilt truck equipped with an X15N engine. These trucks must fuel at the Clean Energy network of stations in California. In 2024, customers contracted 37 trucks under the California Fleet Fund, and we expect 100 additional trucks to be ordered in 2025.
Airports
We estimate that vehicles serving airports in the U.S., including airport delivery fleets, rental car and parking passenger shuttles and taxis, consume an aggregate of approximately two billion gallons of fuel per year. Additionally, many U.S. airports face emissions challenges and are under regulatory directives and political pressure to reduce pollution, particularly as part of any expansion plans. As a result, many of these airports have adopted various strategies to address tailpipe emissions, including rental car and hotel shuttle consolidation and requiring or encouraging service vehicle operators to switch their fleets to our vehicle fuels.
Refuse
We believe that there are nearly 200,000 refuse trucks in the U.S. that collect and haul refuse and recyclables, which aggregately consume approximately two billion gallons of fuel per year. We estimate that approximately 60% of new refuse trucks are capable of operating on RNG, up from approximately 3% of new refuse trucks in 2008. Refuse haulers are increasingly adopting trucks that run on our vehicle fuels to realize operational savings and to address demands for reduced emissions from the public, investors, and governmental agencies. As of December 31, 2024, we fuel approximately 16,100 refuse vehicles for customers including Waste Management, Republic Services, Waste Connections, GFL Environmental, Atlas Disposal, Burrtec, CR&R, Recology and Waste Pro, among others. We also provide vehicle fueling services to municipal refuse fleets.
Public Transit
We believe that there are over 72,000 municipal transit buses operating in the U.S. In many areas, increasingly stringent emissions standards have limited the fueling options available to public transit operators. Also, transit agencies typically fuel at a central location and use high volumes of fuel. We estimate that transit agencies in the U.S. consume approximately one billion gallons of fuel per year. Many transit agencies have been early adopters of vehicles using our fuels, and approximately 30% of existing transit buses and approximately 35% of new transit buses can operate on RNG. As of December 31, 2024, public transit customers for which we serve include the Los Angeles County Metropolitan Transit Authority, New York MTA, Foothill Transit (Los Angeles County, California), Orange County Transit Authority, Santa Monica Big Blue Bus, Dallas Area Rapid Transit, Phoenix Transit, New Jersey Transit, Jacksonville Transportation Authority, NICE Bus (Nassau County, New York) and Washington Metro Area Transportation Authority.
Competition
There are many other companies operating in the renewable energy and waste-to-energy space. Regarding RNG production and supply, our primary competition is from other companies or solutions for access to biogas from waste. Evolving customer preferences, regulatory conditions, ongoing waste industry trends, and project economics have a strong effect on the competitive landscape. We have demonstrated a track record of strategic flexibility across our history which has allowed us to pivot towards projects and markets that we believe deliver optimal returns and stockholder value in response to changes in market, regulatory and competitive pressures. The biogas and RNG markets are heavily fragmented. We believe we are in a strong position to compete for new project development and supply opportunities. Competition for such opportunities, however, including the prices being offered for fuel supply, affect the profitability of the opportunities we pursue, and may make opportunities unsuitable to pursue.
The market for vehicle fuels is highly competitive. The biggest competition for RNG use as a vehicle fuel is diesel because most vehicles in our key markets are powered by this fuel. Many established businesses are in the market for RNG and other alternatives for use as vehicle fuel, including alternative vehicle and alternative fuel companies, refuse collectors,
13
industrial gas companies, truck stop and fuel station owners, fuel providers, utilities and their affiliates and other organizations. We also compete with suppliers of other alternative vehicle fuels, including renewable diesel, biodiesel and ethanol, as well as producers and fuelers of alternative vehicles, including hybrid, electric and hydrogen-powered vehicles. Additionally, our stations compete directly with other natural gas fueling stations and indirectly with electric vehicle charging stations and fueling stations for other vehicle fuels. In addition, we transport and sell CNG through NG Advantage’s virtual natural gas pipelines and interconnects and compete with other participants in this market.
If the alternative vehicle fuel market grows then the number and type of participants in this market and their level of capital and commitments to alternative vehicle fuel programs will increase. We compete for vehicle fuel users based on demand for the type of fuel, which may be affected by a variety of factors, including, among others, cost, supply, availability, quality, cleanliness, and safety of the fuel; cost, availability and reputation of vehicles and engines; convenience and accessibility of fueling stations; regulatory mandates and other requirements; and recognition of the brand. We believe we compare favorably with our competitors based on these factors; however, some of our competitors have substantially greater financial, marketing, and other resources than we have. As a result, these competitors may be able to respond more quickly to changes in customer preferences, legal requirements or other industry or regulatory trends; devote greater resources to the development, promotion and sale of their products; adopt more aggressive pricing policies, dedicate more effort to infrastructure and systems development in support of their business or product development activities; implement more robust or creative initiatives to advance customer acceptance of their products; or exert more influence on the regulatory landscape that impacts the vehicle fuels market.
Governmental Regulation
We are subject to a variety of federal, state and local laws and regulations relating to the environment, health and safety, labor and employment, building codes and construction, zoning and land use, the government procurement process, any political activities or lobbying in which we may engage, public reporting and taxation, among others. Many of these laws and regulations are complex, change frequently and have become more stringent over time. Any changes to existing regulations, adoption of new regulations or failure by us to comply with applicable regulations may result in significant additional expense to us or to our customers or a variety of administrative, civil, and criminal enforcement measures, any of which could have a material adverse effect on our business, reputation, financial condition and results of operations. Certain regulations that significantly affect our various operating activities are described below. Compliance with these regulations has not had a material effect on our capital expenditures, earnings, or competitive position to date, but new regulations or amendments to existing regulations to make them more stringent could have such an effect in the future. We cannot estimate the expenses we may incur to comply with potential new laws or changes to existing laws, or the other potential effects these laws may have on our business, and these unknown costs and effects are not specifically contemplated by our existing customer agreements or our budgets and cost estimates.
We are subject to federal, state, and local air quality, solid waste, and water quality regulations and permitting requirements. Specific construction and operating permit requirements may differ among states. Specific permits we frequently must obtain include air permits, nonhazardous waste management permits, pollutant discharge elimination permits, and beneficial use permits. We must also maintain compliance with relevant federal, state and local environmental, health and safety requirements.
RNG projects are subject to federal RFS program regulations. The EPA administers the RFS program with volume requirements for several categories of renewable fuels. The EPA’s RFS regulations establish rules for fuel supplied and administer the RIN system for compliance, trading credits and rules for waivers. The EPA calculates a blending standard for each year based on estimates of gasoline usage from the Department of Energy’s Energy Information Agency. Separate quotas and blending requirements are determined for cellulosic biofuels, biomass-based diesel, advanced biofuels, and total renewable fuel. Further, we are required to register each RNG project with the EPA and relevant state regulatory agencies. We qualify our RINs through a voluntary Quality Assurance Plan, which typically takes from three to five months from first injection of RNG into the commercial pipeline system. Further, we may make a large project investment prior to receiving the regulatory approval and RIN qualification. In addition to registering each RNG project, we are subject to quarterly audits under the Quality Assurance Plan of our projects to validate our qualification.
14
Our operations are also subject to state renewable fuel standard regulations. The CA LCFS program requires producers of petroleum-based fuels to reduce the CI of their products, which began with a quarter of a percent in 2011 to a 10% total reduction by 2020, and a 20% total reduction by 2030. Petroleum importers, refiners and wholesalers can either develop their own low-carbon fuel products or buy CA LCFS credits from other companies that develop and sell low-carbon alternative fuels, such as biofuels, electricity, natural gas, or hydrogen. We are subject to a qualification process like that for RINs, including verification of CI levels and other requirements existing for CA LCFS credits.
Before an RNG project can be developed, all Resource Conservation and Recovery Act (“RCRA”) Subtitle D requirements (requirements for nonhazardous solid waste management) must be satisfied. In particular, because methane is explosive in certain concentrations and poses a hazard if it migrates, biogas collection systems must meet RCRA Subtitle D standards for gas control. RNG projects may be subject to other federal, state and local regulations that impose requirements for nonhazardous solid waste management.
Certain of our operations may be subject to federal requirements to prepare for and respond to spills or releases from tanks and other equipment and provide training on operation, maintenance and discharge prevention procedures and the applicable pollution control laws. We may be required to develop spill prevention, control and countermeasure plans to memorialize our preparation and response plans and to update them on a regular basis.
Our operations may result in liability for hazardous substances or other materials placed into soil or groundwater. Pursuant to the Comprehensive Environmental Response, Compensation and Liability Act of 1980 or other federal, state, or local laws governing the investigation and cleanup of sites contaminated with hazardous substances, we may be required to investigate and/or remediate soil and groundwater contamination at our projects, contiguous and adjacent properties and other properties owned and/or operated by third parties.
Additionally, biogas projects may need to obtain National Pollutant Discharge Elimination System permits if wastewater is discharged directly to a receiving water body. If wastewater is discharged to a local sewer system, biogas projects may need to obtain an industrial wastewater permit from a local regulatory authority for discharges to a Publicly Owned Treatment Works. The authority to issue these permits may be delegated to state or local governments by the EPA. The permits, which typically last five years, limit the quantity and concentration of pollutants that may be discharged. Permits may require wastewater treatment or impose other operating conditions to ensure compliance with the limits. In addition, the Clean Water Act and implementing state laws and regulations require individual permits or coverage under general permits for discharges of storm water runoff from certain types of facilities.
On September 23, 2020, the California Governor issued an Executive Order N-79-20 setting goals for expanding the sale and use of zero-emission vehicles within California, including 100% of in-state sales of new passenger cars and trucks to be zero-emission by 2035, and 100% of medium- and heavy-duty truck vehicles in California to be zero-emission by 2045 for all operations where feasible. The Governor also directed CARB to develop and propose regulations to achieve these goals consistent with state and federal law. As a result, CARB adopted the Advanced Clean Truck (“ACT”) rule in June 2020 which mandates the manufacture of zero emissions trucks (“ZETs”) by January 2024, and the Advanced Clean Fleet (“ACF”) rule, adopted in April of 2023, which mandates fleets to increasingly purchase ZETs starting in 2025. ACT received an EPA waiver from the Biden Administration whereas the ACF rule did not. Consequently, CARB chose to withdraw the ACF’s waiver application on January 13, 2025. It is possible that the Trump Administration may withdraw the EPA waiver given to California over the ACT. We expect California will face difficulties in implementing the ACT without significant fleet purchase requirements. Currently, ACF can only legally mandate state and local government fleets to purchase ZETs which may be insufficient to sustain the manufacturing numbers required by ACT over time. To succeed, ACT may need to be significantly modified to include low NOx trucks that meet a minimum of 50mg NOx emissions standard as set by CARB’s Omnibus rule. Executive Order B55-18 sets a statewide target to achieve carbon neutrality no later than 2045. The transitioning of California’s energy markets to increased reliance on renewable and carbon-free sources has the potential to create favorable market conditions for RNG but could also harm our vehicle fueling business. Future regulatory actions will be required to meet the state’s zero-emission and carbon neutrality targets.
15
Employees and our Human Capital
As of December 31, 2024, we employed 577 people. We have not experienced any work stoppages, and none of our employees are subject to collective bargaining agreements.
The success and growth of our business is significantly correlated with our ability to recruit, train, promote and retain talented individuals at all levels of our organization. To succeed in a competitive labor market, we have developed and maintain key recruitment and retention strategies. These include competitive salary structures, including bonus compensation programs, and competitive benefits policies, including paid time off for vacations, sick leave and holidays, short-term disability coverage, group term life insurance, and various retirement savings and incentive plans.
Safety of our personnel is a core value of Clean Energy and maintaining a safe work environment is critical to an energy company’s ability to attract and retain employees.
Sales and Marketing
We market our brands, products and services primarily through our direct sales force, which includes sales representatives covering all of our major geographic and customer markets, as well as attendance at trade shows and participation in industry conferences and events. Our sales and marketing team also work closely with federal, state and local government agencies to provide education about the value of our vehicle fuels and to keep abreast of proposed and newly adopted regulations that affect our industry. We also do paid advertising in outlets that reach the transportation markets and have an active social media presence.
Seasonality
To some extent, our business may experience seasonality. For more information, see the discussion under “Seasonality and Inflation” in Item 7. “Management’s Discussion and Analysis of Financial Condition and Results of Operations.”
Intellectual Property
Our intellectual property rights primarily consist of trade secrets, patents, know-how, trademarks and copyrights, and we rely on a combination of trademark laws, patent laws, trade secret laws, copyrights laws, confidentiality provisions and other contractual provisions to protect these rights and our proprietary information. These intellectual property rights help us to protect our innovations, retain existing business and secure new relationships with customers.
We have a total of 13 issued patents currently active, including 10 patents issued by the United States Patent and Trademark Office (“USPTO”) and 3 patents issued by the Canadian Intellectual Property Office (“CIPO”), expiring between 2027 and 2036. Additionally, we have 12 registered trademarks, including 9 trademarks registered with the USPTO and 3 trademarks registered with the CIPO, expiring between 2025 and 2034, and 6 trademark applications pending, including 3 trademark applications pending with the USPTO and 3 trademark applications pending with the CIPO.
More Information
Our website is located at www.cleanenergyfuels.com. We make available, free of charge on our website, our annual reports on Form 10-K, quarterly reports on Form 10-Q, current reports on Form 8-K and amendments to those reports filed or furnished pursuant to Section 13(a) or 15(d) of the Exchange Act as soon as reasonably practicable after we electronically file such material with, or furnish it to, the SEC. The SEC maintains a website at www.sec.gov that contains reports, proxy and information statements and other information regarding issuers that file electronically with the SEC, including us. All references to our website in this report are inactive textual references, and the contents of our website are not incorporated into this report.
16
Item 1A. Risk Factors
An investment in our Company involves a high degree of risk of loss. You should carefully consider the risk factors discussed below and all of the other information included in this report before you make any investment decision regarding our securities. We believe the risks and uncertainties described below are the most significant we face, but additional risks and uncertainties not known to us or that we currently deem immaterial could also be or become significant. The occurrence of any of these risks could harm our business, financial condition, results of operations, prospects and reputation and could cause the trading price of our common stock to decline.
Risks Related to Our Business
Our success is dependent on the willingness of fleets and other customers to adopt our vehicle fuels, which may not occur in a timely manner, at expected levels or at all.
Our success is highly dependent on the adoption by fleets and other customers of our RNG and conventional natural gas vehicle fuels. The market for our vehicle fuels has experienced slow, volatile and unpredictable growth in many sectors. For example, adoption and deployment of our vehicle fuels in heavy-duty trucking has been slower and more limited than we anticipated. Also, other important fleet markets, including airports, refuse, and public transit, had slower volume and customer growth in recent years that may continue. If the market for our vehicle fuels does not develop at improved rates or levels, or if a market develops but we are not able to capture a significant share of the market or the market subsequently declines, our business, prospects, financial condition, and operating results would be harmed.
Factors that may influence the adoption of our vehicle fuels, many of which are beyond our control, include, among others: lack of demand for trucks that use our vehicle fuels; adoption or expansion of government policies, programs, funding or incentives, or increased publicity or popular sentiment in favor of vehicles or fuels other than RNG and natural gas, including long-standing support for diesel-powered vehicles, changes to emissions requirements applicable to vehicles and fleets powered by diesel, RNG, natural gas, or other vehicle fuels and/or growing support for renewable diesel, electric and hydrogen-powered vehicles; and limitations on the capabilities of utilities to provide services to meet our requirements. For example, natural gas utilities may be unable to expand piping or provide services for new expansions, and electric utilities may lack the capacity to provide service for our projects; perceptions about the benefits of our vehicle fuels relative to diesel and other alternative vehicle fuels, including with respect to factors such as supply, cost savings, environmental benefits and safety; increases, decreases or volatility in the supply, demand, use and prices of crude oil, diesel, RNG, natural gas and other vehicle fuels, such as electricity, hydrogen, renewable diesel, biodiesel and ethanol; inertia among fleets and fleet vehicle operators, who may be unable or unwilling to prioritize converting a fleet to our vehicle fuels over an operator’s other general business concerns, particularly if the operator is not sufficiently incentivized by emissions regulations or other requirements or lacks demand for the conversion from its customers, drivers, or other stakeholders; vehicle cost, fuel efficiency, availability, quality, safety, convenience (to fuel and service), design, performance and residual value, as well as operator perception with respect to these factors, generally and in our key customer markets and relative to comparable vehicles powered by other fuels; the development, production, cost, availability, performance, sales and marketing and reputation of engines that are well-suited for the vehicles used in our key customer markets, including heavy-duty trucks and other fleets; increasing competition in the market for vehicle fuels generally, and the nature and effect of competitive developments in this market, including improvements in or perceived advantages of other vehicle fuels and engines powered by these fuels; the impact of federal or state laws, orders or regulations mandating new or additional limits on GHG emissions, “tailpipe” emissions or internal combustion engines, including the Advanced Clean Trucks regulation, the September 2020 Executive Order, the Advanced Clean Fleets regulation and the 2021 Executive Order (each as defined below); the availability and effect of environmental, tax or other government regulations, programs or incentives that promote our products or other alternatives as a vehicle fuel, including certain programs under which we generate credits by selling RNG as a vehicle fuel, as well as the market prices for such credits; and emissions and other environmental regulations and pressures on producing, transporting, and dispensing our fuels.
In addition, as our customers and partners react to economic conditions and the potential for a global recession, they may reduce spending and take additional precautionary measures to limit or delay expenditures and preserve capital and liquidity. Reductions in spending, delays in purchasing decisions, lack of renewals, inability to attract new customers,
17
uncertainty about business continuity as well as pressure for extended billing terms or pricing discounts, could limit our ability to grow our business and negatively affect our operating results and financial condition.
We are dependent on the production of vehicles and engines in our key customer and geographic markets by manufacturers, over which we have no control.
Vehicle and engine manufacturers control the development, production, quality assurance, cost and sales and marketing of their products, which shapes the performance, availability and reputation of these products in the marketplace. We are dependent on these manufacturers to succeed in our target markets, and we have no influence or control over their activities. A small number of manufacturers, chiefly Cummins, produce engines that use our vehicle fuels. The number of manufacturers making vehicles that use our fuels is limited as well. These manufacturers may decide not to expand or maintain, or may decide to discontinue or curtail, their engine or vehicle product lines for a variety of reasons, including as a result of the cost of development and production as a result of increased tariffs in the U.S. or retaliatory tariffs against the U.S., or adoption or modification of government policies or programs such as the Advanced Clean Trucks regulation, the September 2020 Executive Order, the Advanced Clean Fleets regulation, and the January 2025 Executive Order (as defined below). The limited production of engines and vehicles that use our fuels increases their cost and limits availability, which restricts large-scale adoption, and may reduce resale value, which may contribute to operator reluctance to convert their fleets to vehicles that use our fuels. In addition, some operators have communicated to us that earlier models of heavy-duty truck engines using our fuels have a reputation for unsatisfactory performance, and that this reputation or their first-hand experiences of such performance may be a factor in operator decisions regarding whether to convert their fleets to vehicles that use our fuels. If manufactures of vehicles and engines that use our fuels develop unsatisfactory vehicles or engines, then our business, financial condition, and results of operations may be adversely affected.
Our RNG business may not be successful.
Our RNG business consists of procuring RNG from projects we plan to develop and own or from projects owned by third-party producers and reselling this RNG through our fueling infrastructure. The success of our RNG business depends on our ability to secure, on acceptable terms, a sufficient supply of RNG; sell this RNG in adequate volumes and at prices that are attractive to customers and produce acceptable margins for us; and sell Environmental Credits we may generate under applicable federal or state programs from our sale of RNG as a vehicle fuel at favorable prices, as well as our ability to appropriately balance supply we take with demand from customers. Our ability to maintain an adequate supply of RNG is subject to risks affecting RNG production, including unpredictable production levels or other difficulties due to, among others, problems with equipment, severe weather, droughts, financial condition or bankruptcy or insolvency of the applicable ADG and LFG source owner, health crises and pandemics, construction delays, technical difficulties, high operating costs, limited availability, unfavorable composition of collected feedstock gas, and plant shutdowns caused by upgrades, expansion, required maintenance, or other operational issues. The agriculture industry generally, and the dairy industry in particular, are subject to risks and uncertainties that may lead to financial and other challenges impacting RNG production levels and potentially our future investments in RNG projects. For example, the dairy farm partner with whom we have contracted for our project in East Valley, Idaho filed for Chapter 11 bankruptcy protection in April 2024, which could have a material adverse impact on our RNG production, contractual rights, and investment for that project.
Our ability to balance supply with demand from customers is subject to risk where we are committed to acquire RNG produced by third-party producers that could exceed the level of demand of our customers. If we are unable to maintain an adequate supply of RNG or are oversupplied with RNG versus customer demand, our business, financial condition, and performance could be negatively affected. In addition, increasing demand for RNG will result in more robust competition for supplies of RNG, including from other vehicle fuel providers, gas utilities and other users and providers. If we or any of our RNG suppliers experience these or other difficulties in RNG production processes, or if competition for RNG development projects and supply increases, then our supply of RNG and our ability to resell it as a vehicle fuel could be jeopardized.
Our ability to generate revenue from our sale of RNG or our generation and sale of Environmental Credits depends on many factors, including the markets for RNG as a vehicle fuel and for Environmental Credits. The markets for Environmental Credits have been volatile and unpredictable in recent periods, and the prices for these credits are subject to fluctuations (see “Our Principal Products, Services and Other Business Activities—Sales of Environmental Credits” in
18
Part I, Item 1 of this report for more information on the fluctuations in 2024). Additionally, the value of Environmental Credits, and consequently the revenue levels we may receive from our sale of these credits, may be adversely affected by changes to the federal and state programs under which these credits are generated and sold, prices for and use of oil, diesel or gasoline, the inclusion of additional qualifying fuels in the programs, increased production and use of other fuels in the programs, or other conditions. Our ability to generate revenue from sales of Environmental Credits depends on our strict compliance with these federal and state programs, which are complex and can involve a significant degree of judgment. If the agencies that administer and enforce these programs disagree with our judgments, otherwise determine we are not in compliance, conduct reviews of our activities or make changes to the programs, then our ability to generate or sell these credits could be restricted, permanently limited, or lost entirely, and we could also be subject to fines or other sanctions. Any of these outcomes could force us to purchase credits in the open market to cover any credits we have contracted to sell, retire credits we may have generated but not yet sold, reduce or eliminate a significant revenue stream, or incur substantial additional and unplanned expenses. Any permanent or temporary discontinuation or suspension of federal and state programs that provide credits, grants and incentives, such as the AFTC, which expired on December 31, 2024 and has not been renewed, or the Section 45Z Production Tax Credit would also adversely impact our revenue. Moreover, in the absence of programs that allow us to generate and sell Environmental Credits or other federal and state programs that support the RNG vehicle fuel market, or if our customers are not willing to pay a premium for RNG, we may be unable to operate our RNG business profitably or at all.
Our commercial success depends on our ability and the ability of our third-party supply sources to successfully develop and operate projects and produce expected volumes of RNG.
Our specific focus on RNG exposes us to risks related to the supply of and demand for RNG and Environmental Credits, the cost of capital expenditures, government regulation, including increased and/or new tariffs on equipment supply and raw materials, and economic conditions, among other factors. As an RNG supplier we may also be negatively affected by lower RNG production resulting from lack of feedstock, mechanical breakdowns, faulty technology, competitive markets, or changes to the laws and regulations that mandate the use of renewable energy sources.
In addition, other factors related to the development and operation of renewable energy projects could adversely affect our business, including: (i) changes in pipeline gas quality standards or other regulatory changes that may limit our ability to transport RNG on pipelines for delivery to vehicles or increase the costs of processing RNG to allow for such deliveries; (ii) construction risks, including the risk of delay, that may arise because of inclement weather, natural disasters, accidents, labor disruptions, disputes, or increases in costs for or shortages of equipment and construction materials; (iii) operating risks; (iv) weather conditions; (v) financial condition of the applicable source owner, including obstacles to their ability to adequately fund their operations or pay vendors and creditors; (vi) health of the applicable dairy herd; (vii) consolidation in the dairy industry; (viii) budget overruns; (ix) possible liabilities because of unforeseen environmental, construction, technological or other complications; (x) failures or delays in obtaining desired or necessary rights, including leases and feedstock agreements; (xi) diseases and health crises; and (xii) failures or delays in obtaining and keeping in good standing permits, authorizations and consents from local city, county, state and U.S. federal governments as well as local and U.S. federal governmental organizations. Any of these factors could prevent completion or operation of projects, or otherwise adversely affect our business, financial condition, and results of operations.
Acquisition, financing, construction, and development of projects by us or our partners that own projects and divestitures, investments or other strategic relationships, may not commence on anticipated timelines or at all, may not meet expectations, and may otherwise harm our business.
Our strategy is to continue to expand, including through the acquisition of additional projects and by signing additional supply agreements with third-party project owners. From time to time, we and our partners enter into nonbinding letters of intent for projects. Until the negotiations are final, however, and the parties have executed definitive documentation, we or our partners may not be able to consummate any development or acquisition transactions, or any other similar arrangements, on the terms set forth in the applicable letter of intent or at all. The acquisition, financing, construction and development of projects involves numerous risks, including: the ability to obtain financing for a project on acceptable terms or at all; difficulties in identifying, obtaining, and permitting suitable sites for new projects; failure to obtain all necessary rights to land access and use; inaccuracy of assumptions with respect to the cost and schedule for completing construction; inaccuracy of assumptions with respect to the biogas potential, including quality, volume, and asset life;
19
delays in deliveries or increases in the price of equipment; permitting and other regulatory issues, license revocation and changes in legal requirements; increases in the cost of labor, labor disputes and work stoppages; potential business, financial stress or bankruptcy of partners or applicable source owners; failure to receive quality and timely performance of third-party or utility services; unforeseen engineering and environmental problems; cost overruns, including as a result of increased and/or new tariffs on equipment supply and raw materials; accidents involving personal injury or the loss of life; and weather conditions, catastrophic events, including fires, explosions, earthquakes, droughts and acts of terrorism, and other force majeure events.
Additionally, we may acquire or invest in other companies or businesses or pursue other strategic transactions or relationships, such as joint ventures, collaborations, divestitures, or other similar arrangements. These strategic transactions and relationships and any others we may pursue in the future involve numerous risks, any of which could harm our business, performance and liquidity, including, among others, the following: (i) difficulties integrating the operations, personnel, contracts, service providers and technologies of an acquired company or partner; (ii) diversion of financial and management resources from existing operations or other opportunities; (iii) failure to realize the anticipated synergies or other benefits of a transaction or relationship; (iv) risks of entering new customer or geographic markets in which we may have limited or no experience; (v) potential loss of our or an acquired company’s or partner’s key employees, customers, vendors or assets in the event of an acquisition or investment; and (vi) incurrence of substantial costs or debt or equity dilution to fund an acquisition, investment or other transaction or relationship, as well as possible write-offs or impairment charges relating to any businesses we partner with, invest in or acquire. Further, our partners, including TotalEnergies, bp and Chevron, may reallocate their resources from RNG to other renewable or low carbon vehicle fuels. Any such action would have a material adverse effect on our plans, results of operations and financial condition.
To secure ADG RNG from new projects we develop, we typically face a long and variable development cycle that requires significant resource commitments and a long lead time before we realize revenue.
The development, design and construction process for ADG RNG projects generally lasts between 12 to 24 months on average. Prior to entering into a letter of intent with respect to an ADG RNG project, we typically conduct a preliminary assessment of whether the site is commercially viable based on our expected return on investment, investment payback period, and other operating metrics, as well as whether the necessary permits to develop a project on that site are available. After entering into a project letter of intent, we perform a more detailed review of the site’s facilities, including a life-cycle assessment, which serves as the basis for the final specifications of the project. Finally, we negotiate and execute contracts with the site owner and other parties. This extended development process requires the dedication of significant time and resources from our personnel, with no certainty of success or recovery of our expenses. Further, upon commencement of operations, it takes about 15-18 months for the project to ramp up to expected production level, receive necessary registrations and approvals from the Environmental Protection Agency (“EPA”) and CARB, and begin generating revenue. All these factors, and in particular, expenditures on development of projects that will not generate significant revenue in the near term, can contribute to fluctuations in our financial performance and increase the likelihood that our operating results in a particular period will fall below investor expectations.
Livestock waste and dairy farm projects are dependent on LCFS credits and RINS.
Livestock waste and dairy farm projects are heavily dependent on the LCFS credits and, to a lesser extent, RINs for commercial viability. If CARB reduces the CI score that it applies to waste conversion projects, such as dairy digesters, the number of LCFS credits for RNG generated at livestock waste and dairy farm projects will decline. Additionally, revenue from LCFS credits also depends on the price per LCFS credit. LCFS credit prices are driven by various market forces, including the supply of and demand for LCFS credits, which depends on the demand for traditional and other renewable fuels and mandated CI targets, which determine the number of LCFS credits required to offset LCFS deficits. Fluctuations in the price of LCFS credits or the number of LCFS credits assigned will significantly affect the success of our livestock waste and dairy farm projects. RINs and LCFS Credit prices have fluctuated in recent years and will likely continue to be volatile. A significant decline in the value of LCFS credits could adversely affect our business, financial condition, and results of operations.
20
We have a history of losses and may incur additional losses in the future.
We have incurred pre-tax losses in the past, may incur losses in the future, and may never sustain profitability, any of which would adversely affect our business, prospects and financial condition and may cause the price of our common stock to fall. Furthermore, historical losses may not be indicative of future losses, and our future losses may be greater than our past losses. In addition, to try to achieve or sustain profitability, we may choose or be forced to take actions that result in material costs or material asset or goodwill impairments. For instance, we have recorded significant charges in connection with our closure of certain fueling stations, our determination that certain assets were impaired because of the foregoing, and other actions. We review our assets for impairment whenever events or changes in circumstances indicate that the carrying value of an asset or asset group may not be recoverable, and we perform a goodwill impairment test on an annual basis and between annual tests in certain circumstances, in each case in accordance with applicable accounting guidance and as described in the financial statements and related notes included in this report. For example, due to a decline in the market price of our common stock, we determined that an indicator of potential goodwill impairment existed as of March 31, June 30, September 30, 2024, and December 31, 2024 and as such, we performed interim goodwill impairment tests during each of the quarters ended March 31, June 30, September 30, 2024 and December 31, 2024 of our single reporting unit.
In addition, changes to the use of our assets, divestitures, changes to the structure of our business, significant negative industry or economic trends, disruptions to our operations, inability to effectively integrate any acquired businesses, further market capitalization declines, or other similar actions or conditions could result in additional asset impairment or goodwill impairment charges or other adverse consequences, any of which could have material negative effects on our financial condition, our results of operations and the trading price of our common stock.
Our plans for hydrogen and electric vehicle stations will require significant cash investments and management resources and may not meet our expectations.
As operators deploy hydrogen powered vehicles, we plan to modify our fueling stations, build additional hydrogen stations, and deliver clean hydrogen. Further, we have the capability to add electric charging at our sites, and we believe our RNG can be used to generate clean electricity to power vehicles. Our plans will require significant cash investments and management resources and may not meet our expectations with respect to additional sales of our vehicle fuels. We have experience constructing hydrogen fueling stations, but such facilities cost significantly more than traditional RNG vehicle fueling stations. In addition, we have not yet added electric charging capability to any of our stations, and the cost of such capability may be significant. We will need to ensure compliance with all applicable regulatory requirements, including obtaining any required permits and land use rights, which could take considerable time and expense and is subject to the risk that government support in certain areas may be discontinued. If we are unable to modify our stations to provide hydrogen or add electric charging to our stations, or if we experience delays in doing so, our stations may be unable to meet our customer demand, which may negatively impact our business, prospects, financial condition, and operating results. Additionally, even if we are able to successfully modify our stations to provide hydrogen or electric charging stations, we will be dependent on the manufacturers of hydrogen and electric vehicles to succeed in our target markets, and we will have no influence over their activities. See the risks discussed under “We are dependent on the production of vehicles and engines in our key customer and geographic markets by original equipment manufacturers, over which we have no control,” above and elsewhere in these risk factors.
Increases, decreases and general volatility in oil, diesel, renewable diesel, natural gas, RNG and Environmental Credit prices could adversely affect our business.
The prices of RNG, natural gas, crude oil, diesel, renewable diesel, and Environmental Credits can be volatile, and this volatility may continue to increase. Factors that may cause volatility in the prices of RNG, natural gas, crude oil, diesel, renewable diesel, and Environmental Credits include, among others, changes in supply and availability of crude oil, RNG and other renewable transportation fuels, and natural gas, government regulations, inventory levels, customer demand, price and availability of alternatives, weather conditions, negative publicity about crude oil or natural gas drilling, production or transportation techniques and methods, worldwide economic, military, health and political conditions, transportation costs and the price of foreign imports. If the prices of crude oil and diesel are low or decline, or if the price of RNG or natural gas increases without corresponding increases in the prices of crude oil and diesel or Environmental
21
Credits, we may not be able to offer our customers an attractive price for our vehicle fuels, market adoption of our vehicle fuels could be slowed or limited and/or we may be forced to reduce the prices at which we sell our vehicle fuels in order to try to attract new customers or prevent the loss of demand from existing customers. Natural gas and crude oil prices are expected to remain volatile for the near future because of market uncertainties over supply and demand, including due to the state of the world economy, geopolitical conditions, military conflicts such as the wars in Ukraine and the Middle East, energy infrastructure and other factors. Fluctuations in natural gas prices affect the cost to us of the natural gas commodity. High natural gas prices adversely affect our operating margins when we cannot pass the increased costs through to our customers. Conversely, lower natural gas prices reduce our revenue when the commodity cost is passed through to our customers.
Pricing conditions may also exacerbate the cost differential between vehicles that use our fuels and diesel-powered vehicles, which may lead operators to delay or refrain from purchasing or converting to our vehicle fuels. Generally, vehicles that use our fuels cost more initially than diesel-powered vehicles because the components needed for a vehicle to use our fuels add to the vehicle’s base cost. Operators then seek to recover the additional base cost over time through a lower cost to use our fuels. Operators may, however, perceive an inability to timely recover these additional initial costs if our vehicle fuels are not available at prices sufficiently lower than diesel. Such an outcome could decrease our potential customer base and harm our business prospects.
We face increasing competition from competitors, many of which have far greater resources, customer bases and brand awareness than we have, and we may not be able to compete effectively with these businesses.
The market for vehicle fuels is highly competitive. The biggest competition for our products is diesel because most vehicles in our key markets are powered by these fuels. We also compete with suppliers of other alternative vehicle fuels, including renewable diesel, biodiesel, and ethanol, as well as producers and fuelers of alternative vehicles, including hybrid, electric and hydrogen-powered vehicles. Additionally, our stations compete directly with other natural gas fueling stations and indirectly with electric vehicle charging stations and fueling stations for other vehicle fuels. Many businesses are in the market for RNG and other alternatives for use as vehicle fuel, including alternative vehicle and alternative fuel companies, refuse collectors, industrial gas companies, private equity groups, commodity traders, truck stop and fuel station owners, fuel providers, gas marketers, utilities and their affiliates and other organizations. If the alternative vehicle fuel market grows, the number and type of participants in this market and their level of capital and other commitments to alternative vehicle fuel programs could increase. Many of our competitors have substantially greater customer bases, brand awareness and financial, marketing and other resources than we have. As a result, these competitors may be able to respond more quickly to changes in customer preferences, legal requirements or other industry or regulatory trends; devote greater resources to the development, promotion and sale of their products; adopt more aggressive pricing policies; dedicate more effort to infrastructure and systems development in support of their business or product development activities; implement more robust or creative initiatives to advance customer acceptance of their products; or exert more influence on the regulatory landscape that affects the vehicle fuels market. We expect competition to increase in the vehicle fuels market generally. In addition, if the demand for alternative vehicle fuels, including RNG, increases, then we expect competition to also increase. Any such increased competition may reduce our customer base and revenue and may lead to increased pricing pressure, reduced operating margins and fewer expansion opportunities.
We rely on information technology in our operations, and any material failure, inadequacy, interruption, or security failure of that technology could harm our business.
Increased global cybersecurity threats and more sophisticated and targeted computer crime pose a risk to the security of our information systems and the confidentiality, availability and integrity of our data. There have been several recent, highly publicized cases in which organizations of various types and sizes have reported the unauthorized disclosure of customer or other confidential information, as well as cybersecurity incidents involving the dissemination, theft and destruction of corporate information, intellectual property, cash or other valuable assets. There have also been several highly publicized cases in which hackers have requested “ransom” payments in exchange for not disclosing customer or other confidential information or for not disabling the target company’s computer or other systems. Implementing security measures designed to prevent, detect, mitigate or correct these or other cybersecurity threats involves significant costs. Despite implementing security measures, we have, from time to time, experienced cyberattacks or other cybersecurity incidents that have threatened our data and information systems. It is possible that future cybersecurity incidents could
22
materially and adversely affect our business. We cannot provide assurance that our safety and security measures will prevent our information systems from improper functioning or damage, or the improper access or disclosure of personally identifiable information such as in the event of cybersecurity incidents. Any IT security threats that are successful against our security measures could, depending on their nature and scope, lead to the compromise of confidential information, improper use of our systems and networks, manipulation and destruction of data, operational disruptions, and substantial financial outlays. A cybersecurity incident could occur and persist for an extended period without detection, and an investigation of any successful cybersecurity incident would likely require significant time, costs and other resources to complete. We may be required to expend significant financial resources to protect against or to remediate such cybersecurity incidents. In addition, our information technology infrastructure and information systems are vulnerable to damage or interruption from natural disasters, power loss and telecommunications failures.
The company relies on third party service providers, software as a service providers, and technologies to operate critical business systems and process sensitive information. Our ability to monitor these third parties’ information security practices is limited, and they may not have adequate information security measures in place, or they may suffer unexpected downtime due to power loss, computer system or data network failures. Any security incident or other type of interruption, our information systems may become disabled or inaccessible, disrupting our operations.
The integration of Internet of Things (“IoT”) and Artificial Intelligence (“AI”) technologies into our business operations presents both significant opportunities and inherent risks. While these technologies offer the potential to enhance efficiency, improve decision-making, and create value, they also expose the company to various operational, cybersecurity, and regulatory risks. The reliance on IoT and AI systems for critical business operations necessitates high levels of system reliability and performance. Any malfunction, failure, or suboptimal performance of these systems can disrupt business activities, resulting in downtime, reduced productivity, and financial losses. Inaccurate, incomplete, or corrupted data can lead to flawed decision-making, inefficiencies, and potential financial and operational risks. IoT and AI systems are vulnerable to cyber threats, including data breaches, hacking, and unauthorized access. A successful cyber-attack can compromise sensitive company information, customer data, and intellectual property, leading to financial losses, legal liabilities, and reputational damage. The use of IoT and AI technologies involves collecting and processing large volumes of personal and proprietary data. Any mishandling or unauthorized access to this data can result in privacy breaches, regulatory penalties, and loss of customer trust. The regulatory landscape for IoT and AI technologies is evolving rapidly. The company must ensure compliance with existing and emerging regulations related to data protection, privacy, and cybersecurity. Non-compliance can result in significant legal and financial penalties and impact business operations
Any failure to maintain proper function, security and availability of the information systems and the data maintained in those systems we use could interrupt our operations, damage our reputation, subject us to liability claims or regulatory penalties, harm our business relationships or increase our security and insurance costs, which could have a material adverse effect on our business, financial condition and results of operations.
NG Advantage may not be successful.
NG Advantage provides “virtual pipelines” to transport CNG by truck from compression facilities to pipeline interconnects and to industrial and commercial customer users that do not have direct access to natural gas pipelines. NG Advantage faces unique risks, including among others: (i) it has a history of net losses; (ii) NG Advantage may need to raise additional capital, which may not be available, may only be available on onerous terms, or may only be available from the Company; (iii) the labor market for truck drivers is very competitive, which increases NG Advantage’s difficulty in meeting its delivery obligations; (iv) NG Advantage often transports CNG in trailers over long distances and these trailers may be involved in accidents; and (v) NG Advantage’s CNG trailers may become subject to new or changed regulations that could adversely affect its business. If NG Advantage fails to manage any of these risks, our business, financial condition, liquidity, results of operations, prospects and reputation may be harmed. In addition, we have been a significant source of financing for NG Advantage. If NG Advantage needs to raise additional capital and is not able to obtain financing from external sources, we may need to provide additional debt or equity capital to allow NG Advantage to satisfy its commitments and maintain operations.
23
Our station construction activities subject us to business and operational risks.
As part of our business activities, we design and construct vehicle fueling stations that we either own and operate ourselves or sell to our customers. These activities require a significant amount of judgment in determining where to build and open fueling stations, including predictions about fuel demand that may not be accurate for any of the locations we target. As a result, we have built stations that we may not open for fueling operations, and we may open stations that fail to generate the volume or profitability levels we anticipate, either or both of which could occur due to a lack of sufficient customer demand at the station locations or for other reasons. For any stations that are completed but unopened, we would have substantial investments in assets that do not produce revenue, and for any stations that are open and underperforming, we may decide to close the stations. We have nearly completed stations that are not open for fueling operations. Some of these stations are subject to agreements that will expire prior to us being able to open such stations and, as a result, we will incur substantial additional costs and non-cash asset impairments or other charges to remove or abandon equipment located at such stations, which could cause the price of our common stock to decline. For example, our Liquified Natural Gas Fueling Station and LNG Master Sales Agreement with Pilot Travel Centers, LLC (“Pilot”) may expire in August 2025 per its terms, and may not be renewed. If a new agreement is not reached, the Company would abandon and remove its assets located at 55 Pilot stations. In connection with the potential removal of station equipment and site improvements, the Company may recognize up to approximately $55.0 million in accelerated depreciation expense relating to the change in depreciable life of the 55 station assets. Amounts associated with the accelerated depreciation expense would be included in “Depreciation and amortization” at the time the Company decides to abandon the station assets.
We also face many operational challenges in connection with our station design and construction activities. For example, we may not be able to identify suitable locations for the stations we or our customers seek to build. Additionally, even if preferred sites can be located, we may encounter land use or zoning difficulties, problems with utility services, challenges obtaining and retaining required permits and approvals or local resistance, including due to reduced operations of permitting agencies because of health crises, any of which could prevent us or our customers from building new stations on these sites or limit or restrict the use of new or existing stations. Any such difficulties, resistance or limitations or any failure to comply with local permit, land use or zoning requirements could restrict our activities or expose us to fines, reputational damage or other liabilities, which would harm our business and results of operations. In addition, we act as the general contractor and construction manager for new station construction and facility modification projects, and we typically rely on licensed subcontractors to perform the construction work. We may be liable for any damage we or our subcontractors cause or for injuries suffered by our employees or our subcontractors’ employees during the course of work on our projects.
Additionally, increased and/or new tariffs on equipment supply and raw materials, and shortages of skilled subcontractor labor could significantly delay a project or otherwise increase our costs. For example, the Trump Administration has imposed and announced plans to impose broad-based tariffs on imports from many countries, including China, Mexico, and Canada, as well as countries of the European Union, Japan. Such tariffs could cause the cost of procuring material and equipment used in the construction and development of our stations to significantly increase. Further, our expected profit from a project is based in part on assumptions about the cost of the project, and cost overruns, delays or other execution issues may, in the case of projects we complete and sell to customers, result in our failure to achieve our expected margins or cover our costs, and in the case of projects we build and own, result in our failure to achieve an acceptable rate of return. If any of these events occur, our business, operating results and liquidity could be negatively affected.
We have significant contracts with government entities, which are subject to unique risks.
We have, and expect to continue to seek, long-term fueling station construction, maintenance and fuel sale contracts with various government bodies, which accounted for 27%, 30% and 22% of our revenue in 2022, 2023 and 2024, respectively. In addition to normal business risks, including the other risks discussed in these risk factors, our contracts with government entities are often subject to unique risks, some of which are beyond our control. For example, long-term government contracts and related orders are subject to cancellation if adequate appropriations for subsequent performance periods are not made. Further, the termination of funding for a government program supporting any of our government contracts or any other governmental action that results in reduced support for our government contracts could result in the loss of anticipated future revenue attributable to the contract. Moreover, government entities with which we contract are
24
often able to modify, curtail or terminate contracts with us at their convenience and without prior notice, and would only be required to pay for work completed and commitments made at or prior to the time of termination.
In addition, government contracts are frequently awarded only after competitive bidding processes, which are often protracted. In many cases, unsuccessful bidders for government contracts are provided the opportunity to formally protest the contract awards through various agencies or other administrative and judicial channels. The protest process may substantially delay a successful bidder’s contract performance, result in cancellation of the contract award entirely and distract management. As a result, we may not be awarded contracts for which we bid, and substantial delays or cancellation of contracts may follow any successful bids as a result of any protests by other bidders. The occurrence of any of these risks would have a material adverse effect on our results of operations and financial condition.
Our results of operations fluctuate significantly and are difficult to predict.
Our results of operations have historically experienced, and may continue to experience, significant fluctuations as a result of a variety of factors, including, among others, the amount and timing of our vehicle fuel sales, Environmental Credit sales and recognition of government credits, station construction sales, grants and incentives, such as AFTC, which expired on December 31, 2024 and has not been renewed (for example, we recorded all of the AFTC revenue associated with our vehicle fuel sales made in the first and second quarters of 2022 during the third quarter of 2022); fluctuations in commodity, station construction and labor costs, including as a result of increased and/or new tariffs on equipment supply and raw materials; fluctuations in expenditures and resource commitments due to new ADG RNG project developments; variations in the fair value of certain of our derivative instruments that are recorded in revenue; sales of compressors and other equipment used in RNG production and at fueling stations; the amount and timing of our billing, collections and liability payments; weather and seasonality; and the other factors described in these risk factors.
Our performance in certain periods has also been affected by transactions or events that have resulted in significant cash or non-cash gains or losses. These or other similar gains or losses may not recur, in the same amounts or at all in future periods. These significant fluctuations in our operating results may render period-to-period comparisons less meaningful, such as with respect to periods heavily impacted by effects of the COVID-19 pandemic or periods impacted by non-cash asset impairment charges related to station closures, and investors in our securities should not rely on the results of one period as an indicator of performance in any other period. Additionally, these fluctuations in our operating results could cause our performance in any period to fall below the financial guidance we may have provided to the public or the estimates and projections of the investment community, which could negatively affect the price of our common stock.
A pandemic, epidemic or other infectious disease outbreaks, such as the COVID-19 pandemic, may adversely harm our business.
Our business may be adversely impacted by a future pandemic or epidemic, such as the COVID-19 pandemic. For example, as a result of the COVID-19 pandemic, we experienced increased costs on equipment and construction services, and longer lead times on equipment and materials orders. Any future pandemic, epidemic, or infectious disease outbreak could also adversely affected our business through delaying the adoption of our RNG and natural gas vehicle fuels by heavy-duty trucks and/or a delaying increased usage of our vehicle fuels; decreasing the volume of truck and fleet operations, including shuttle buses at airports, refuse trucks, and public transportation generally, and disrupting production of vehicles and engines that use our fuels. Any of the foregoing may result in decreased demand for our vehicle fuels, plant closures, decreased manufacturing capacity, and delays in deliveries, which would negatively impact our business, operations, and financial condition.
Our future success will depend on our ability to attract and retain qualified management, technical, and other personnel.
Our future success is dependent on the services and performance of our executive officers and other key management, engineering, information technology, scientific, manufacturing and operating personnel. The loss of the services of any such personnel could materially adversely affect our business. Our ability to achieve our strategic plans will also depend on our ability to attract and retain additional qualified personnel. Recruiting key personnel in our industry is highly
25
competitive and we cannot assure you that we will be able to do so. Our inability to attract and retain additional qualified personnel, or the departure of key employees, could materially and adversely affect our strategic plans and, therefore, our business, results of operations and financial condition. In addition, our inability to attract and retain sufficient personnel to quickly increase production at our facilities when and if needed to meet increased demand may adversely impact our ability to respond rapidly to any new product, growth or revenue opportunities.
Risks Related to Our Indebtedness and Other Capital Resources.
We may need to raise additional capital to continue to fund our business, which could have negative effects and may not be available when needed, on acceptable terms or at all.
We require capital to pay for capital expenditures, operating expenses, any mergers, acquisitions or strategic investments, capital calls related to our joint ventures, transactions or relationships we may pursue, and to make principal and interest payments on our indebtedness. If we cannot fund any of these activities with capital on-hand or cash provided by our operations, we may seek additional capital from other sources, such as by selling assets or pursuing debt or equity financing.
Asset sales and equity or debt financing may not be available when needed, on terms favorable to us or at all. Any sale of our assets to generate cash proceeds may limit our operational capacity and could limit or eliminate any revenue streams or business plans that are dependent on the sold assets. Any issuances of our common stock or securities convertible into our common stock to raise capital would dilute the ownership interest of our existing stockholders. Any additional debt financing we may pursue could require us to make significant interest or other payments. In addition, higher levels of indebtedness could increase our risk of non-repayment, adversely affect our creditworthiness, and amplify the other risks associated with our existing debt, which are discussed elsewhere in these risk factors. Further, we may incur substantial costs in pursuing any capital-raising transactions, including investment banking, legal and accounting fees. On the other hand, if we are unable to obtain capital in amounts sufficient to fund our obligations, expenses, and strategic initiatives, we could be forced to suspend, delay or curtail our business plans or operating activities or could default on our contractual commitments. Any such outcome could negatively affect our business, performance, liquidity, and prospects.
Our indebtedness could adversely affect our financial condition or operating flexibility and prevent us from fulfilling our obligations under our credit agreement and other indebtedness we may incur, and we may not generate sufficient cash flow from our business to pay our debt.
On December 12, 2023, we and our wholly-owned direct subsidiary Clean Energy entered into a senior secured first lien term loan agreement (as amended, supplemented or otherwise modified, the “Stonepeak Credit Agreement”) with the lenders from time to time party thereto, including certain affiliates of Stonepeak Partners LP (“Stonepeak Partners”), a leading alternative investment firm specializing in infrastructure and real assets, and Alter Domus Products Corp., as the administrative agent for the lenders and collateral agent for the secured parties, pursuant to which the Lenders funded a $300,000,000 senior secured term loan and committed to making an additional $100,000,000 of delayed draw term loans available for the two-year period after closing. As of December 31, 2024, we had total consolidated indebtedness of $268.1 million, net of debt discount, and we may incur additional debt in the future. Our outstanding and any future indebtedness could make us more vulnerable to adverse changes in general U.S. and worldwide economic conditions, including rising interest rates, regulatory, and competitive conditions, limit our flexibility to plan for or react to changes in our business or industry, place us at a disadvantage compared to our competitors that have less debt, or limit our ability to borrow or otherwise raise additional capital as needed.
Our payments of amounts owed under our various debt instruments will reduce our cash resources available for other purposes, including pursuing strategic initiatives, transactions or other opportunities, satisfying our other commitments, and generally supporting our operations. Moreover, our ability to make these payments depends on our future performance, which is subject to economic, financial, competitive and other factors, including those described in these risk factors, and many of which are beyond our control. Our business may not generate sufficient cash from operations to service our debt. If we cannot meet our debt obligations from our operating cash flows, we may pursue one or more alternative measures. Any repayment of our debt with equity, however, would dilute the ownership interests of our existing stockholders. We
26
are permitted under the Stonepeak Credit Agreement to incur additional debt under certain conditions. If new debt were to be incurred in the future, the related risks that we now face could intensify. The Stonepeak Credit Agreement requires us and our subsidiaries, on a consolidated basis, to comply with a maximum total net leverage ratio, a minimum interest coverage ratio, and a minimum liquidity test. In addition, the Stonepeak Credit Agreement contains certain covenants that limit or restrict our and our subsidiaries’ ability to incur liens, incur indebtedness, dispose of assets, make investments, make certain restricted payments, merge or consolidate, amend our charter documents and certain other agreements, and enter into speculative hedging arrangements. In the event of any default on our debt obligations, the holders of the indebtedness could, among other things, declare all amounts owed immediately due and payable and foreclose on our assets that serve as collateral. Any such declaration could deplete all or a large portion of our available cash flow, and thereby reduce the amount of cash available to pursue our business plans or force us into bankruptcy or liquidation.
Our warranty reserves may not adequately cover our warranty obligations, which could result in unexpected costs.
We provide product warranties with varying terms and durations for the stations we build and sell, and we establish reserves for the estimated liability associated with these warranties. Our warranty reserves are based on historical trends and any specifically identified warranty issues known to us, and the amounts estimated for these reserves could differ materially from the warranty costs we may actually incur. We would be adversely affected by an increase in the rate or volume of warranty claims or the amounts involved in warranty claims, any of which could increase our costs beyond our established reserves and cause our cash position and financial condition to suffer.
Risks Related to Environmental Health and Safety and Governmental and Environmental Regulations
Our business is influenced by environmental, tax and other government regulations, programs and incentives that promote our vehicle fuels, and their modification or repeal could negatively affect our business.
Our business is influenced by federal, state, and local tax credits, rebates, grants and other government programs and incentives that promote or exclude the use of our vehicle fuels. These include various government programs that make grant funds available from the purchase of vehicles and construction of fueling stations or dairy digesters, as well as the AFTC, which expired on December 31, 2024 and has not been renewed, under which we generated revenue for our vehicle fuel sales. Additionally, our business is influenced by laws, rules and regulations that require reductions in carbon emissions and/or the use of renewable fuels, such as the programs under which we generate Environmental Credits.
These programs and regulations, which have the effect of encouraging the use of RNG as a vehicle fuel, could expire or be repealed or amended for a variety of reasons. For example, parties with an interest in gasoline and diesel, electric or other alternative vehicles or vehicle fuels, including lawmakers, regulators, policymakers, environmental or advocacy organizations, producers of alternative vehicles or vehicle fuels, or other powerful groups, may invest significant time and money in efforts to delay, repeal or otherwise negatively influence regulations and programs that promote RNG. Many of these parties have substantially greater resources and influence than we have. Further, challenges to agencies’ rules and regulations and their interpretations of such rules and regulations, and changes in federal, state or local political, social or economic conditions, including as a result of a lack of legislative focus on these programs and regulations or prolonged U.S. government shutdown, could result in their modification, delayed adoption or repeal. For example, the Inflation Reduction Act of 2022 (“IRA”) contains credits and tax incentives that have been and may in the future be beneficial to us but an executive order issued by President Trump in January 2025 (the “January 2025 Executive Order”) has paused disbursement of certain funds under the IRA and there can be no assurance that we will be able to continue to benefit from such credits in the future.
Additionally, in its June 2024 decision in Loper Bright Enterprises v. Raimondo (the “Loper decision”), the U.S. Supreme Court overturned the longstanding Chevron doctrine, under which courts were required to give deference to regulatory agencies’ reasonable interpretations of ambiguous federal statutes. The Loper decision could result in additional legal challenges to regulations and guidance issued by federal agencies applicable to our operations. Further, the Loper decision may result in increased regulatory uncertainty, inconsistent judicial interpretations and other impacts to the agency rulemaking process. We cannot predict which additional measures may be adopted or the impact of current and additional measures on the programs and regulations we rely on, Environmental Credits, which could have a material adverse effect on our business, financial condition and results of operations. Any failure to adopt, delay in implementing, expiration,
27
repeal or modification of these programs and regulations, or the adoption of any programs or regulations that encourage the use of other alternative fuels or alternative vehicles over RNG, could reduce the market for RNG as a vehicle fuel and harm our operating results, liquidity, and financial condition.
To benefit from Environmental Credits, RNG projects are required to be registered and are subject to audit.
RNG projects are required to register with the EPA and relevant state regulatory agencies. Further, we qualify our RINs through a voluntary Quality Assurance Plan, which typically takes from three to five months from first injection of RNG into the commercial pipeline system. We also must certify RNG pathways with CARB, which typically takes from 15 to 18 months from first injection of RNG into the commercial pipeline system. Delays in obtaining registration, RIN qualification, and any LCFS credit qualification of a new project could delay future revenues from a project and could adversely affect our cash flow. Further, we may make large investments in projects prior to receiving the regulatory approval and RIN qualification. By registering RNG projects with the EPA’s voluntary Quality Assurance Plan and by establishing RNG pathways under CARB’s LCFS program, we are subject to third-party audits and on-site visits of projects to validate generated RINs and overall compliance with the federal renewable fuel standard and the LCFS. We are also subject to a separate third party’s annual attestation review. The Quality Assurance Plan provides a process for RIN owners to follow, for an affirmative defense to civil liability, if used or transferred Quality Assurance Plan verified RINs were invalidly generated. A project’s failure to comply could result in remedial action, including penalties, fines, retirement of RINs, or termination of the project’s registration, any of which could adversely affect our business, financial condition and results of operations.
Our business could be negatively affected by federal or state laws, orders or regulations mandating new or additional limits on GHG emissions, “tailpipe” emissions or internal combustion engines.
Federal or state laws, orders or regulations have been adopted, such as California’s AB 32 cap and trade law, and may in the future be adopted that impose limits on GHG emissions or otherwise require the adoption of zero-emission electric vehicles. The effects of GHG emission limits on our business are subject to significant uncertainties based on, among other things, the timing of any requirements, the required levels of emission reductions, the nature of any market-based or tax-based mechanisms adopted to facilitate reductions, the relative availability of GHG emission reduction offsets, the development of cost-effective, commercial-scale carbon capture and storage technology and supporting regulations and liability mitigation measures, the range of available compliance alternatives, and our ability to demonstrate that our vehicle fuels qualify as a compliance alternative under any statutory or regulatory programs to limit GHG emissions. If our vehicle fuels are not able to meet GHG emission limits or perform as well as other alternative fuels and vehicles, our solutions could be less competitive. Furthermore, additional federal or state taxes could be implemented on “tailpipe” emissions or on methane emissions generally, which would have a negative impact on the cost of our vehicle fuels, as compared to vehicle fuels that do not generate tailpipe emissions.
In June 2020, CARB adopted the Advanced Clean Trucks regulation, which requires manufacturers to sell a gradually increasing proportion of zero-emission electric trucks, vans and pickup trucks from 2024 onwards. By the year 2045, the Advanced Clean Trucks (the “ACT”) regulation seeks to have every new commercial vehicle sold in California be zero-emissions. Further, in September 2020, the Governor of the State of California issued an executive order (the “September 2020 Executive Order”) providing that it shall be the goal of California that (i) 100% of in-state sales of new passenger cars and trucks will be zero-emission by 2035, (ii) 100% of medium- and heavy-duty vehicles in California will be zero-emission by 2045 for all operations, where feasible, and by 2035 for drayage trucks, and (iii) the state will transition to 100% zero-emission off-road vehicles and equipment by 2035 where feasible. The September 2020 Executive Order also directed CARB to develop and propose regulations and strategies aimed at achieving the foregoing goals. Resulting regulations mandate increasing adoption of zero-emission vehicles. The ACT received a federal EPA waiver from the Biden administration. It is possible that the Trump Administration may withdraw the federal EPA waiver given to California over the ACT. California will face difficulties in implementing the ACT without significant fleet purchase requirements. To succeed, ACT may need to be significantly modified to include low NOx trucks that meet a minimum of 50mg NOx emissions standard as set by CARB’s Omnibus rule.
In April 2023, CARB adopted the Advanced Clean Fleets (the “ACF”) regulation, which requires all public transit truck fleets, including municipal and other governments, be zero emission by 2042. The ACF regulation also sought to
28
end the sale of combustion trucks in California in 2036. The ACF did not received a federal EPA waiver and CARB chose to withdraw the ACF’s waiver application in January 2025. As it stands now, ACF can only legally mandate state and local government fleets to purchase ZETs which may be insufficient to sustain the manufacturing numbers required by ACT over time.
Among other things, we believe the intent of the ACT, the September 2020 Executive Order, and the ACF regulation is to limit and ultimately discontinue the production and use of internal combustion engines because such engines have “tailpipe” emissions. Implementation of such regulations and executive actions may slow, delay or prevent the adoption by fleets and other commercial customers of our vehicle fuels, particularly in California. Moreover, other states have enacted, or have taken steps to enact, similar regulations, which may slow, delay, change, or prevent the adoption of our vehicle fuels in those states as well. These actions could result in state funding and incentive programs being directed only to the adoption of zero emission vehicles. In December 2021, President Biden signed an executive order (the “2021 Executive Order”) that directs the federal government to achieve certain goals, including purchasing 100% zero-emission vehicles by 2035 for its fleet of over 600,000 cars and trucks.
Our business is subject to a variety of government regulations, including environmental regulations, which may restrict our operations and result in costs and penalties or otherwise adversely affect our business and ability to compete.
We are subject to a variety of federal, state and local laws and regulations relating to the environment, health and safety, labor and employment, building codes and construction, zoning and land use, the government procurement process, any political activities or lobbying in which we may engage, public reporting and taxation, among others. It is difficult and costly to manage the requirements of every authority having jurisdiction over our various activities and to comply with their varying standards. Many of these laws and regulations are complex, change frequently, may be unclear and difficult to interpret and have become more stringent over time. Any changes to existing regulations, adoption of new regulations, or judicial rulings regarding such regulations, may result in significant additional expense to us or our customers. For example, our operations are and will be subject to federal, state and local environmental laws and regulations, including laws relating to the use, handling, storage, disposal of and human exposure to hazardous materials. Contamination at properties we own or operate, will own or operate, or formerly owned or operated to which hazardous substances were sent by us, are subject to the Comprehensive Environmental Response, Compensation and Liability Act, which can impose liability for the full amount of remediation-related costs without regard to fault, for the investigation and cleanup of contaminated soil and ground water, for impacts to human health and for damages to natural resources.
Further, from time to time, as part of the regular evaluation of our operations, including newly acquired or developing operations, we may be subject to compliance audits by regulatory authorities, which may distract management from our revenue-generating activities and involve significant costs and use of other resources. Also, we often need to obtain facility permits or licenses to address, among other things, storm water or wastewater discharges, waste handling and air emissions in connection with our operations, which may subject us to onerous or costly permitting conditions or delays if permits cannot be timely obtained. Our failure to comply with any applicable laws and regulations could result in property damage, bodily injury or a variety of administrative, civil and criminal enforcement measures, including, among others, assessment of monetary penalties, imposition of corrective requirements, including cleanup costs, or prohibition from providing services to government entities. If any of these enforcement measures were imposed on us, our business, financial condition, and performance could be negatively affected.
Our operations entail inherent safety and environmental risks, which may result in substantial liability to us.
Our operations entail inherent safety risks, including risks associated with equipment defects, malfunctions, failures, and misuses. For example, operation of LNG pumps requires special training because of the extremely low temperatures of LNG. Also, LNG tanker trailers and CNG fuel tanks and trailers could rupture if involved in accidents or improper maintenance or installation. Further, improper refueling of vehicles that use our fuels or operation of vehicle fueling stations could result in sudden releases of pressure that could cause explosions. In addition, our operations may result in the venting of methane, which is flammable and is a potent GHG. These safety and environmental risks could result in uncontrollable flows of our fuels, fires, explosions, death, or serious injury, any of which may expose us to liability for personal injury, wrongful death, property damage, pollution and other environmental damage. We may incur substantial liability and costs if any such damages are not covered by insurance or are more than our policy limits, or if environmental
29
damage causes us to violate applicable GHG emissions or other environmental laws. Additionally, the occurrence of any of these events with respect to our fueling stations or our other operations could materially harm our business and reputation. Moreover, the occurrence of any of these events to any other organization in our vehicle fuel business could harm our industry generally by negatively affecting perceptions about, and adoption levels of, our vehicle fuels.
Risks Related to Our Common Stock
A significant portion of our outstanding common stock is owned or otherwise subject to acquisition by three equityholders, each of which may have interests that differ from the Company’s other stockholders and which now or in the future may be able to influence the Company’s corporate decisions, including a change of control.
After giving effect to the issuance of the Amazon Warrant and the Stonepeak Warrant (defined below), Total Marketing Services, S.A.S (“TMS”), a wholly owned subsidiary of TotalEnergies, owns approximately 19% of our outstanding shares of common stock as of December 31, 2024. In addition, TotalEnergies was granted certain special rights that our other stockholders do not have in connection with its acquisition of this ownership position, including the right to designate two individuals to serve as directors of our Company and a third individual to serve as an observer on certain of our board committees.
The Amazon Warrant was immediately exercisable by Amazon Holdings for 4.999% of our outstanding common stock when issued. Subject to additional vesting through fuel purchase from the Company pursuant to the Fuel Agreement, the Amazon Warrant will be exercisable for up to 19.999% of our outstanding common stock on a fully diluted basis (determined at the time of issuance), subject to certain anti-dilution provisions, and Amazon Holding’s beneficial ownership will initially be contractually limited to the beneficial ownership limitation unless Amazon Holdings gives the Company 61 days’ notice that it is waiving such limitation.
The Stonepeak Warrant is exercisable at any time after December 12, 2025 for up to 9.999% of our common stock outstanding immediately after giving effect to such exercise, and Stonepeak’s beneficial ownership will initially be contractually limited to such beneficial ownership limitation unless Stonepeak gives the Company 61 days’ notice that it is waiving such limitation.
TotalEnergies or other current or future large stockholders may be able to influence or control matters requiring approval by our stockholders, including the election of directors, mergers and acquisitions, or other extraordinary transactions. Large stockholders may have interests that differ from other stockholders and may vote or otherwise act in ways with which the Company or other stockholders disagree or that may be adverse to your interests. A concentration of stock ownership may also have the effect of delaying, preventing or deterring a change of control of our Company, which could deprive our stockholders of an opportunity to receive a premium for their shares of our common stock as part of a sale of our Company and could affect the market price of our common stock. Conversely, such a concentration of stock ownership may facilitate a change of control under terms other stockholders may not find favorable or at a time when other stockholders may prefer not to sell.
Sales of our common stock, or the perception that such sales may occur, could cause the market price of our stock to drop significantly, regardless of the state of our business.
All outstanding shares of our common stock are eligible for sale in the public market, subject in certain cases to the requirements of Rule 144 under the Securities Act. Also, shares of our common stock that may be issued upon the exercise, vesting or conversion of our outstanding stock options and restricted stock units may be eligible for sale in the public market, to the extent permitted by Rule 144 and the provisions of the applicable stock option and restricted stock unit agreements or if such shares have been registered under the Securities Act. Sales of large amounts of our common stock by large stockholders, or the perception that such sales may occur, could cause the market price of our common stock to decline, regardless of the state of the Company’s business. Our common stock held by TMS, our common stock underlying the Amazon Warrant, and our common stock underlying the Stonepeak Warrant may be sold in the public market under Rule 144 or in registered sales or offerings pursuant to registration rights held by each stockholder. If these shares are sold, or if it is perceived that they may be sold, in the public market, the trading price of our common stock could decline.
30
The price of our common stock may continue to fluctuate significantly, and you could lose all or part of your investment.
The market price of our common stock has experienced, and may continue to experience, significant volatility. Factors that may cause volatility in the price of our common stock, many of which are beyond our control, include, among others, the following: (i) the factors that may influence the adoption of our vehicle fuels, as discussed elsewhere in these risk factors; (ii) our ability to implement our business plans and initiatives and their anticipated, perceived or actual level of success; (iii) failure to meet or exceed any financial guidance we have provided to the public or the estimates and projections of the investment community; (iv) the market’s perception of the success and importance of any of our acquisitions, divestitures, investments or other strategic relationships or transactions; (v) the amount and timing of sales of, and prices for, Environmental Credits; (vi) actions taken by state or federal governments to mandate or otherwise promote or incentivize alternative vehicles or vehicle fuels over, or to the exclusion of, RNG; (vii) technical factors in the public trading market for our common stock that may produce price movements that may or may not comport with macro, industry or company-specific fundamentals, including, without limitation, the sentiment of retail investors (including as may be expressed on financial trading and other social media sites), the amount and status of short interest in our common stock, access to margin debt, and trading in options and other derivatives on our common stock; (viii) changes in political, regulatory, health, economic and market conditions; and (ix) a change in the trading volume of our common stock.
In addition, the securities markets have from time-to-time experienced significant price and volume fluctuations that are unrelated to the operating performance of particular companies, but which have affected the market prices of these companies’ securities. These market fluctuations may also materially and adversely affect the market price of our common stock. Volatility or declines in the market price of our common stock could have other negative consequences, including, among others, further impairments to our assets, potential impairments to our goodwill and a reduced ability to use our common stock for capital-raising, acquisitions or other purposes. The occurrence of any of these risks could materially and adversely affect our financial condition, results of operations and liquidity and could cause further declines in the market price of our common stock.
Item 1B. Unresolved Staff Comments.
None.
Item 1C. Cybersecurity.
When reviewing potential threats or cybersecurity incidents, our Board of Directors has delegated the authority to the Audit Committee to setup crisis incident management teams comprised of senior management and appropriate specialists.
31
We are not aware of any risks from cybersecurity threats, including as a result of any cybersecurity incidents, which have
Item 2. Properties.
Our corporate headquarters are located at 4675 MacArthur Court, Suite 800, Newport Beach, California 92660, where we occupy approximately 48,000 square feet of office space. Our lease for this facility expires in June 2028.
We own and operate the Boron Plant in Boron, California, approximately 125 miles from Los Angeles. In November 2006, we entered into a 30-year ground lease for the 36 acres on which this plant is situated. The Boron Plant can produce 98.5 million gallons of LNG per year and has a dual tanker trailer loading system and a 1.8 million gallon storage tank that can hold up to 1.5 million usable gallons. The plant had a production utilization rate of 78% and 94% for the years ended December 31, 2023 and 2024, respectively.
We own and operate the Pickens Plant located in Willis, Texas, approximately 50 miles north of Houston. We own approximately 24 acres of land on which this plant is situated, along with approximately 34 acres surrounding the plant. The Pickens Plant can produce 36.5 million gallons of LNG per year and includes a tanker trailer loading system and a 830,000 gallon storage tank that can hold up to 830,000 usable gallons. During the years ended December 31, 2023 and 2024, the Pickens Plant was offline for maintenance and repairs; hence, the plant had no LNG production in 2023 and 2024.
We own, operate or supply 582 fueling stations in the U.S. and 25 in Canada. Fueling stations are facilities where RNG or conventional natural gas is dispensed in the form of CNG or LNG into the fuel tanks of vehicles for use as transportation fuel. We own station equipment throughout the U.S. (See Note 9) that is used for dispensing CNG or LNG at properties we lease under long-term lease arrangements (See Note 15). Additionally, we operate fueling stations or supply CNG or LNG to fueling stations where our customer owns the fueling station equipment. At these stations, we operate under the following arrangements: (i) provide O&M services on a per gallon or fixed fee basis and do not directly sell CNG or LNG, or (ii) provide O&M services and also have a fuel supply sales agreement for CNG or LNG with our customer.
Item 3. Legal Proceedings.
From time to time, we may become involved in various legal proceedings that arise in the ordinary course of our business, including lawsuits, claims, audits, government enforcement actions and related matters. It is not possible to predict when or if these proceedings may arise, nor is it possible to predict the outcome of any proceedings that do arise, including, among other things, the amount or timing of any liabilities we may incur, and any such proceedings could have a material effect on us regardless of outcome. In the opinion of management, however, we are not a party, and our properties are not subject, to any pending legal proceedings that are material to us.
Item 4. Mine Safety Disclosures.
None.
32
PART II
Item 5. Market for Registrant’s Common Equity, Related Stockholder Matters and Issuer Purchases of Equity Securities.
Market Information
Our common stock trades on The Nasdaq Global Select Market under the symbol “CLNE.”
Holders
There were approximately 53 holders of record of our common stock as of February 14, 2025. The actual number of holders of our common stock is greater than this number of record holders and includes stockholders who are beneficial owners, but whose shares are held in street name by brokers or held by other nominees.
Issuer Purchases of Equity Securities
On March 12, 2020, our Board of Directors approved a share repurchase program of up to $30.0 million (exclusive of fees and commissions) of our outstanding common stock (the “Repurchase Program”). On December 7, 2021, our Board of Directors approved an increase in the aggregate amount of our common stock to be repurchased under the Repurchase Program from $30.0 million to $50.0 million (exclusive of fees and commissions). The Repurchase Program does not have an expiration date, and may be suspended or discontinued at any time. As of December 31, 2024, approximately $26.5 million remained available under the Repurchase Program.
The Repurchase Program does not obligate us to acquire any specific number of shares. Repurchases under the Repurchase Program may be effected from time to time through open market purchases, privately negotiated transactions, structured or derivative transactions, including accelerated share repurchase transactions, or other methods of acquiring shares, in each case subject to market conditions, applicable securities laws and other relevant factors. Repurchases may also be made under plans set up pursuant to Rule 10b5-1 promulgated under the Exchange Act.
The Company did not repurchase any shares in the years ended December 31, 2023 and 2024. Any share repurchases under the Repurchase Program will require consent from the Company’s creditor, Stonepeak Partners LP, to remain in compliance with covenants under the Credit Agreement.
Performance Graph
This performance graph shall not be deemed “soliciting material” or “filed” with the SEC or subject to Regulation 14A or 14C or to the liabilities of Section 18 of the Exchange Act, or incorporated by reference into any filing under the Securities Act or the Exchange Act, except to the extent that we specifically request that such information be treated as soliciting material or specifically incorporate it by reference into such a filing. The graph is required by applicable rules of the SEC and is not intended to forecast, predict or be indicative of the possible future performance of our common stock.
33
The following graph compares the five-year total return to holders of our common stock relative to the cumulative total returns of the Nasdaq Global Market Index and the Russell 2000 Index. The graph assumes that $100 was invested in our common stock and in each of these indices at the close of market on December 31, 2019 (the last trading day before the beginning of our fifth preceding fiscal year). We chose to include the Russell 2000 Index because it includes issuers with similar market capitalizations and due to the lack of a comparable industry or line-of-business index or peer group, as we are the only actively traded public company whose only line of business is to sell natural gas for use as a vehicle fuel and the associated equipment and services necessary to use natural gas as a vehicle fuel.
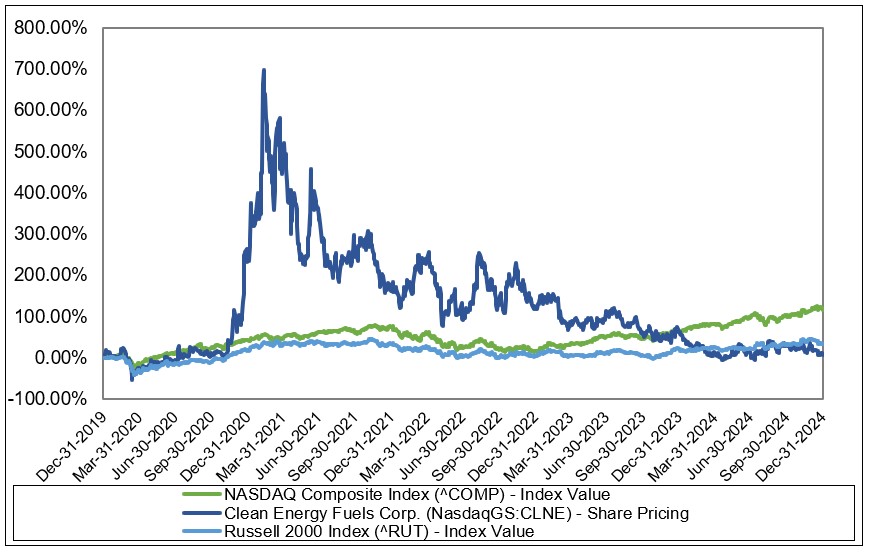
Item 6. [Reserved].
Item 7. Management’s Discussion and Analysis of Financial Condition and Results of Operations.
The following Management’s Discussion and Analysis of Financial Condition and Results of Operations (this discussion, as well as discussions under the same heading in our other periodic reports, are referred to as the “MD&A”) should be read together with our audited consolidated financial statements and the related notes included in this report, and all cross references to notes included in this MD&A refer to the identified note in such consolidated financial statements. This section of the Form 10-K generally discusses 2024 and 2023 items and year-to-year comparisons of 2024 to 2023. Discussions of 2022 items and year-to-year comparisons of 2023 and 2022 that are not included in this Form 10-K can be found in “Management’s Discussion and Analysis of Financial Condition and Results of Operations” in Part II, Item 7 of our Annual Report on Form 10-K for the year ended December 31, 2023, filed with the SEC on February 29, 2024.
Cautionary Note Regarding Forward-Looking Statements
This MD&A contains forward-looking statements. See the discussion about these statements under “Cautionary Note Regarding Forward-Looking Statements” at the beginning of this report.
34
Overview
We are North America’s leading provider of the cleanest fuel for the transportation market, based on the number of stations operated and the amount of gasoline gallon equivalents (“GGEs”) of renewable natural gas (“RNG”) and conventional natural gas sold. We calculate one GGE to equal 125,000 British Thermal Units (“BTUs”) and, as such, one million BTUs (“MMBTU”) equals eight GGEs. Through our sales of RNG, which is derived from biogenic methane produced by the breakdown of organic waste, we help thousands of vehicles, from airport shuttles to city buses to waste and heavy-duty trucks, reduce their amount of climate-harming greenhouse gases (“GHG”) from 60% to over 400% based on determinations by the California Air Resources Board (“CARB”), depending on the source of the RNG, while also reducing criteria pollutants such as Nitrogen Oxides, or NOx. RNG is either delivered as compressed natural gas (“CNG”) or liquefied natural gas (“LNG”).
As a clean energy solutions provider, we supply RNG (sourced from third party sources and from our anaerobic digester gas (“ADG”) RNG joint venture project with TotalEnergies S.E. (the “DR JV”) (see Note 3)) and conventional natural gas (sourced from third party suppliers), in the form of CNG and LNG, for medium and heavy-duty vehicles; design and build, as well as operate and maintain (“O&M”), public and private vehicle fueling stations in the United States (“U.S.”) and Canada; develop and own dairy anaerobic digester gas (“ADG”) RNG production facilities; sell and service compressors and other equipment used in RNG production and at fueling stations; transport and sell RNG and conventional natural gas via “virtual” natural gas pipelines and interconnects; sell U.S. federal, state and local government credits (collectively, “Environmental Credits”) we generate by selling RNG as a vehicle fuel, including Renewable Identification Numbers (“RIN Credits” or “RINs”) under the federal Renewable Fuel Standard Phase 2 and credits under the California, Oregon, and Washington Low Carbon Fuel Standards (collectively, “LCFS Credits”); and obtain federal, state and local tax credits, grants and incentives.
At present, we see the best use of RNG as a replacement for fossil-based fuel in the transportation sector. We believe the most attractive market for RNG is U.S. heavy-duty Class 8 trucking and, based on information from the American Trucking Association and our own internal estimates, we believe there are approximately 4.1 million Class 8 heavy-duty trucks operating in the U.S. that use over 40 billion gallons of fuel per year. As of December 31, 2024, we deliver RNG to the transportation market through 582 fueling stations we own, operate or supply in 43 states and the District of Columbia in the U.S., including over 200 stations in California. We also own, operate, or supply 25 fueling stations in Canada as of December 31, 2024.
Critically, to generate the valuable Environmental Credits, RNG must be placed in vehicle fuel tanks. We believe our stations and customer relationships allow us to deliver substantially more RNG to vehicle operators than any other participant in the market – we calculate that we have access to more fueling stations and vehicle fleets than all our competitors combined. As of December 31, 2024, we served over 1,000 fleet customers operating over 50,000 vehicles on our fuels.
Longer term, we plan to expand availability of hydrogen fuel for vehicle fleets. As operators deploy more hydrogen powered vehicles, we can modify our fueling stations to reform our RNG and deliver clean hydrogen to customers. We also believe our RNG can be used to generate clean electricity to power electric vehicles, and we have the capability to add electric vehicle charging at our station sites, although the cost of adding electric vehicle charging capacity may be significant.
Impact of COVID-19, Inflation, Labor Shortage, Material Availability and Interest Rate
The COVID-19 pandemic had an adverse effect on the volume of our sales, which we saw bottom in the second quarter of 2020. The subsequent surge in cases driven by the omicron variant negatively affected the demand recovery for our vehicle fuels in the first quarter of 2022. Since that time, we have seen improvement in volumes in all customer markets, and the residual effects of the COVID-19 pandemic have not been a significant headwind to our business operations. For more information, see “Risk Factors” in Part I, Item 1A of this report.
In recent periods, we have experienced increases in commodity and supply chain costs due to inflationary pressures. Additionally, effects stemming from disruptions in labor supply and in supply chains, leading to shortages of certain
35
materials and equipment and higher labor costs that have continued to linger to some extent. The future duration and extent of these pressures and effects are difficult to predict. Although we have partially offset these increased costs through price increases for our products and services, our efforts to manage the current inflationary pressure and to recover inflation-based cost increases from our customers may be hampered by the structure of our contracts as well as the competitive and economic conditions of the markets in which we serve. For more information, see “Risk Factors” in Part I, Item 1A of this report.
As of December 31, 2024, the majority of our debt outstanding represents a long-term loan bearing a fixed rate of interest. Changes in market interest rates do not affect the interest expense incurred from this outstanding long-term debt instrument. However, changes in market interest rates may affect the interest rate and corresponding interest expense on any new issuance of short-term and long-term debt securities. See “Quantitative and Qualitative Disclosures about Market Risk” in Part II, Item 7A of this report for more information.
We believe we have sufficient liquidity to support business operations through this volatile period, including total cash and cash equivalents and short-term investments of $217.5 million, excluding current portion of restricted cash, as of December 31, 2024 and $1.0 million of current debt.
Performance Overview
This performance overview discusses matters on which our management focuses in evaluating our financial condition and our operating results.
Sources of Revenue
The following table presents our sources of revenue:
Year Ended December 31, |
|||||||||
Revenue (in millions) |
2022 |
|
2023 |
|
2024 |
||||
Product revenue(1): |
|||||||||
Volume-related(2) |
|||||||||
Fuel sales(3) (5) |
$ |
281.1 |
$ |
287.0 |
$ |
258.9 |
|||
Change in fair value of derivative instruments(4) |
0.5 |
(0.2) |
(0.1) |
||||||
RIN Credits |
34.7 |
25.9 |
39.0 |
||||||
LCFS Credits |
12.6 |
9.9 |
9.9 |
||||||
AFTC(6) |
|
21.8 |
|
20.9 |
|
23.8 |
|||
Total volume-related product revenue |
350.7 |
343.5 |
331.5 |
||||||
Station construction sales |
22.3 |
26.4 |
25.2 |
||||||
Total product revenue |
|
373.0 |
|
369.9 |
|
356.7 |
|||
Service revenue(7): |
|||||||||
Volume-related, O&M services |
45.9 |
52.7 |
56.9 |
||||||
Other services |
1.3 |
2.6 |
2.3 |
||||||
Total service revenue |
|
47.2 |
|
55.3 |
|
59.2 |
|||
Total revenue |
$ |
420.2 |
$ |
425.2 |
$ |
415.9 |
|||
| (1) | A discussion of product revenue is included below under “Results of Operations.” |
| (2) | Our volume-related product revenue primarily consists of sales of RNG and conventional natural gas, in the form of CNG and LNG, and sales of RINs and LCFS Credits in addition to changes in fair value of our derivative instruments. More information about our GGEs of fuel sold in the periods is included below under “Key Operating Data,” and more information about our derivative instruments, which consist of commodity swap and customer fueling contracts, is included in Note 6. |
| (3) | Includes $24.3 million, $60.6 million and $60.8 million of non-cash stock-based sales incentive contra-revenue charges related to the Amazon Warrant (as defined in Note 12) for the years ended December 31, 2022, 2023 and 2024, respectively. |
36
| (4) | The change in fair value of derivative instruments is related to the Company’s commodity swap and customer fueling contracts. The amounts are classified as revenue because the Company’s commodity swap contracts are used to economically offset the risk associated with the diesel-to-natural gas price spread resulting from customer fueling contracts under the Company’s Zero Now truck financing program. |
| (5) | Includes net settlement of the Company’s commodity swap derivative instruments. For the years ended December 31, 2022, 2023 and 2024, net settlement payments recognized in fuel revenue were $7.8 million, $4.9 million and $2.4 million, respectively. |
| (6) | Represents AFTC. AFTC is available for vehicle fuel sales made through December 31, 2024. |
| (7) | Our service revenue primarily represents sales from performance of O&M services. More information about our GGEs serviced in the periods relating to O&M services is included below under “Key Operating Data.” Additionally, a discussion of service revenue is included below under “Results of Operations.” |
Key Operating Data
In evaluating our operating performance, we focus primarily on: (1) the amount of total fuel volume we sell to our customers with particular focus on RNG volume as a subset of total fuel volume, (2) O&M services volume dispensed at facilities we do not own but where we provide O&M services on a per-gallon or fixed fee basis, (3) our station construction cost of sales, and (4) net income (loss) attributable to us. The following tables present our key operating data for the years ended December 31, 2022, 2023 and 2024. Certain gallons are included in both fuel and service volumes when the Company sells fuel (product revenue) to a customer and provides maintenance services (service revenue) to the same customer.
Year Ended |
|||||||||
Fuel volume, GGEs(1) sold (in millions), |
December 31, |
||||||||
correlating to total volume-related product revenue |
|
2022 |
|
2023 |
|
2024 |
|||
RNG |
|
198.2 |
225.7 |
236.7 |
|||||
Conventional natural gas |
|
69.6 |
62.5 |
60.8 |
|||||
Total fuel volume |
|
267.8 |
|
288.2 |
|
297.5 |
|||
Year Ended |
|||||||||
O&M services volume, GGEs(1) serviced (in millions), |
December 31, |
||||||||
correlating to volume-related O&M services revenue |
|
2022 |
|
2023 |
|
2024 |
|||
O&M services volume |
|
240.4 |
256.9 |
263.2 |
|||||
Year Ended |
|||||||||
December 31, |
|||||||||
Other operating data (in millions) |
|
2022 |
|
2023 |
|
2024 |
|||
Station construction cost of sales |
$ |
19.4 |
$ |
24.4 |
$ |
24.4 |
|||
Net loss attributable to Clean Energy Fuels Corp. (2) (3) (4) |
|
$ |
(58.7) |
|
$ |
(99.5) |
|
$ |
(83.1) |
| (1) | GGEs are calculated based on the conversion rate of one MMBTU equaling eight GGEs. |
| (2) | Includes $21.8 million, $20.9 million, and $23.8 million of AFTC revenue for the years ended December 31, 2022, 2023 and 2024, respectively. |
| (3) | Includes $24.3 million, $60.6 million and $60.8 million of non-cash stock-based sales incentive contra-revenue charges relating to the Amazon Warrant (as defined in Note 12) for the years ended December 31, 2022, 2023 and 2024, respectively. |
| (4) | Includes an unrealized gain (loss) from the change in fair value of commodity swap and customer fueling contracts of $0.5 million, $(0.2) million and $(0.1) million for the years ended December 31, 2022, 2023 and 2024, respectively. See Note 6 for more information regarding the commodity swap and customer contracts. |
2023 – 2024 Key Developments
TotalEnergies Joint Venture. In the first quarter of 2023, the DR JV began producing RNG and made its first injection into the natural gas pipeline; since then, the production of RNG at the DR JV has continued to ramp up. On June 27, 2023, the DR JV issued a capital call for $11.0 million of additional funding, requiring TotalEnergies and the Company each to contribute $5.5 million. On June 28, 2023, the Company contributed $5.5 million and advanced $5.5 million to the DR JV. The $5.5 million advance was subsequently refunded to the Company by the DR JV in December 2023. Funds from the capital call were primarily used to fund required loan reserves and to paydown outstanding liabilities of the DR JV. bp Joint Venture. The RNG production facility at Drumgoon Dairy was placed into service in the fourth quarter of 2023. This
37
RNG project is designed to supply approximately 1.7 million GGEs of RNG annually when at full capacity. As of December 31, 2024, there were five RNG projects in the bp Joint Venture (“bpJV”) that were completed. All RNG produced from projects in the bpJV will be available to us for sale as vehicle fuel pursuant to our existing marketing agreement with bp.
In connection with the capital call issued by the bpJV in December 2021, on June 30, 2022, we paid the remaining outstanding contribution balance of $51.6 million to the bpJV and satisfied our capital contribution commitment under this capital call. On March 30, 2022, the bpJV issued a capital call in the amount of $76.2 million, and, on September 30, 2022, we and bp each contributed $38.1 million to the bpJV in connection with this capital call. On December 20, 2023, the bpJV issued a capital call in the amount of $135.9 million, and, on December 28, 2023, we and bp each contributed $67.95 million to the bpJV. Proceeds from these capital calls are used to develop ADG RNG projects and to fund bpJV’s working capital needs.
Tourmaline Joint Development. On April 18, 2023, we and Tourmaline Oil Corp. (“Tourmaline”) announced a CAD $70 million Joint Development Agreement (the “Tourmaline JDA”) to build and operate a network of CNG stations along key highway corridors across Western Canada. Under a 50-50 shared investment, the construction of these CNG fueling stations will allow heavy-duty trucks and other commercial transportation fleets that operate in the area to transition to the use of CNG, a lower carbon alternative to gasoline and diesel. We are operating a CNG fueling station in Edmonton, Alberta, as part of the Tourmaline JDA and have opened two more stations in the municipalities of Calgary and Grande Prairie in Alberta. We expect to open additional CNG fueling stations in Chilliwack and Kamloops in British Columbia and Fort McMurray in Alberta in 2025, with additional locations being evaluated.
Winter 2022–2023 California Natural Gas Prices. From December 2022 to February 2023, the wholesale prices of natural gas in California spiked to historic levels. The January 2023 monthly index for Southern California settled at $54.31, and Henry Hub settled at $4.71, or 11.5 times higher than the industry benchmark index. December 2022 and February 2023 bookended the historic spike with the Southern California monthly index settled at $15.11 and $13.21, respectively, while Henry Hub settled at $6.71 and $3.11, respectively. These settlement prices reflect the monthly index established during the week leading up to the actual delivery month, also known as the bidweek. Drivers of the price increase were a combination of record below normal temperatures, production freeze-offs, pipeline maintenance, and an accelerated depletion of stored natural gas reserves. As a result, we experienced significantly higher gas supply costs, which affected our fueling stations in California in January 2023 and into February 2023. Although we have partially offset the increased costs through price increases from our customers, not all increased costs were recovered due to the competitive nature and market dynamics of the markets in which we serve. We estimate that the natural gas price spike in California from December 2022 to February 2023 resulted in a reduction in gross profit of approximately $10.0 million for the three months ended March 31, 2023. Since then, we have seen wholesale prices of natural gas in California largely revert to normal levels.
South Fork Dairy Farm Project. On April 10, 2023, an accident resulted in a fire at the South Fork Dairy farm in Dimmitt, Texas, the location of one of our consolidated ADG RNG projects under development. The fire killed the dairy cows and burned down the milking facilities. Our partner, South Fork Dairy, is rebuilding the dairy farm and replenishing the dairy cattle. At the time of the incident, we had not commenced onsite construction activities. Rebuilding efforts were initiated in late 2023. Since then, we have begun to prepare for the construction of the ADG RNG project. In July 2024, the Company broke ground on construction of the RNG production facility at South Fork Farm Dairy. The construction of the digesters and processing plant is expected to be completed in 2025 at a cost of approximately $85 million, which will be home to a 16,000-cow herd with an anticipated 2.6 million GGEs of RNG to be produced annually.
EPA Renewable Fuels Standard Update. On June 21, 2023, the Environmental Protection Agency (“EPA”) announced a final rule to establish the renewable volume obligation (“RVO”) for 2023 through 2025, increasing the RVO demand targets by an average of approximately 30% per year over the next three years. We believe this action by the EPA is constructive to the development and use of RNG as a low-carbon fuel for the transportation sector.
Stonepeak Credit Agreement. On December 12, 2023, we entered into a six-year $300 million senior secured first lien term loan (as amended, supplement or otherwise modified, the “Stonepeak Credit Agreement”) with the lenders from time to time party thereto, including certain affiliates of Stonepeak Partners LP (“Stonepeak Partners”), and Alter Domus
38
Products Corp., as the administrative agent for the lenders and collateral agent for the secured parties. The Stonepeak Credit Agreement also provides for a two-year delayed draw term loan commitment of an additional $100 million. In addition to repaying existing loans, the Stonepeak Credit Agreement will provide us with capital for new RNG production facilities, as well as the expansion of our fueling infrastructure targeting the heavy-duty truck market. In connection with this transaction, we issued warrants to Stonepeak (the “Stonepeak Warrant”) providing the right to purchase 10 million shares of common stock at an exercise price of $5.50 per share and 10 million shares of common stock at an exercise price of $6.50 per share. The Stonepeak Warrant expires on June 15, 2032 and is exercisable at any time after December 12, 2025. See Note 11 for more information about our outstanding debt and Note 12 for additional information about the Stonepeak Warrant.
AFTC. The IRA reinstated and extended the AFTC incentive for three years through December 31, 2024, which expired on December 31, 2024. Additionally, the executive order issued by President Trump in January 2025 has paused disbursement of certain funds under the IRA and there can be no assurance that we will be able to continue to benefit from AFTC in the future.
Joint Development Agreement with Maas Energy Works, LLC. In May 2024, we entered into a joint development agreement (the “Maas JDA”) with Maas Energy Works, LLC (“Maas”) that granted us exclusive rights to acquire, fund and participate in the development of certain ADG RNG production projects at dairy farms. Pursuant to the Maas JDA, we have the option to exercise our exclusive development rights with respect to these projects subject to our due diligence. We will record all the associated income/loss in earnings until a certain rate of return is achieved and then receive 49% of the income/loss in earnings with Maas receiving 51%. We contemplate investing up to $132.0 million of equity capital in production projects in connection with the Maas joint development. RNG produced from the ADG RNG project(s) will be available to us for sale as vehicle fuel. As of December 31, 2024, the Company has invested $33.8 million to the Project LLC.
East Valley Dairy Farm Bankruptcy. In April 2024, the dairy farm partner to an ADG RNG production project located in East Valley, Idaho that is currently under construction by the 50-50 joint venture between us and BP Products North America Inc. (the “bpJV”) filed for Chapter 11 bankruptcy protection in the Bankruptcy Court for the District of Idaho (the “Bankruptcy Court”). The bpJV is party to contracts with the dairy farm partner to lease land and to receive manure feedstock for the ADG RNG production facility currently in construction.
The dairy farm partner, in accordance with the Bankruptcy Code, had the exclusive right to propose a plan of reorganization for a limited period of time (the “Exclusivity Period”). In December 2024, the Exclusivity Period expired and was not extended. As a result, creditors of the dairy farm partner became eligible to submit competing plans of reorganization.
In February 2025, the dairy farm partner filed a second amended Chapter 11 bankruptcy plan of reorganization, amending the previous Chapter 11 bankruptcy plan of reorganization filed in December 2024 (the “Plan of Reorganization”), which proposes to accept and continue to perform under the contracts with the bpJV. However, the Plan of Reorganization has not been solicited to creditors or confirmed by the Bankruptcy Court. A secured creditor of the dairy farm has filed a competing plan of reorganization, which also contemplates the acceptance and performance of the contracts with the bpJV in most scenarios. This competing plan of reorganization has also not been solicited to creditors or confirmed by the Bankruptcy Court.
At present, substantial uncertainty exists and a wide range of potential outcomes are possible, including taking a loss of a substantial part of our investment due to the outcome of the proceedings. The Company is gathering facts, closely monitoring the bankruptcy proceedings, and assessing possible future developments and alternatives and the bankruptcy’s potential impact on our business, financial condition or results of operations.
Pilot Fueling Station Equipment Removal. In January 2025, we received notice of non-renewal from Pilot Travel Centers, LLC (“Pilot”) of the Liquified Natural Gas Fueling Station and LNG Master Sales Agreement, dated August 2, 2010, which will expire in August 2025 per its terms. If a new agreement is not reached, the Company would abandon and remove its assets located at 55 Pilot stations. In connection with the potential removal of station equipment and site improvements, the Company may recognize up to approximately $55.0 million in accelerated depreciation expense
39
relating to the change in depreciable life of the 55 station assets. Amounts associated with the accelerated depreciation expense would be included in “Depreciation and amortization” at the time the Company decides to abandon the station assets.
Debt Level and Debt Compliance
As of December 31, 2024, we had total indebtedness, excluding finance lease obligations, of $300.2 million in principal amount, of which $0.1 million is expected to become due in 2025. Certain of the agreements governing our outstanding debt, which are discussed in Note 11, have certain financial and non-financial covenants with which we must comply. As of December 31, 2024, we were in compliance with all of these covenants.
Key Trends
Market for RNG and conventional natural gas as a Vehicle Fuel
According to CARB, RNG and conventional natural gas are cleaner than gasoline and diesel fuel based on the GHG emissions produced by vehicles operated by these fuels. Additionally, RNG and conventional natural gas are generally less expensive for vehicle operators than gasoline and diesel on an energy equivalent basis. According to the U.S. Energy Information Administration, demand for renewable and conventional natural gas fuels in the U.S. has increased in recent years and is expected to continue to increase. We expect our sales of RNG and conventional natural gas to grow as more companies look to operate in an increasingly sustainable way. In addition to pressure from politicians, regulators and non-governmental organizations, the investment community has dramatically increased demands on companies to diminish their contributions to climate change. We believe that RNG is the best tool available today to reduce climate-harming GHG and meet sustainability objectives.
The market for our vehicle fuels, however, is a relatively new and developing market. As a result, it is difficult to accurately predict demand for our vehicle fuels, in general and in any specific geographic and customer markets, and consequently our timing and level of investment in particular markets may not be consistent with any growth in demand in these markets. Further, the new and developing nature of the market for our vehicle fuels has led to slow, volatile or unpredictable growth in many sectors. For example, to date, adoption and deployment of natural gas vehicles, both in general and in certain of our key customer markets, including heavy-duty trucking, have been slower than we anticipated.
We believe challenging market conditions are caused by a number of factors, including the following:
| ● | Volatile prices for oil and diesel, which may decrease the price advantage of our fuels. In addition, these pricing conditions have led us to reduce the prices we charge some customers for our fuels, which has reduced our profit margins. |
| ● | There has been increased focus by some parties, including lawmakers, regulators, policymakers, environmental and advocacy organizations and other powerful groups, on electric or other alternative vehicles or vehicle fuels. For example, the executive order signed by President Biden in December 2021 directs the federal government to achieve certain goals, including replacing its fleet of over 600,000 cars and trucks with 100% zero-emission vehicles by 2035. In addition, California lawmakers and regulators have implemented various measures designed to increase the use of electric, hydrogen and other zero-emission vehicles, including establishing firm goals for the number of these vehicles operating on state roads by specified dates and enacting various laws and other programs in support of these goals. Among other things, we believe many California lawmakers and regulators’ desire to limit and ultimately discontinue the production and use of internal combustion engines is because such engines have “tailpipe” emissions. |
40
| ● | We believe the lack of substantial growth in the heavy-duty trucking market has been driven in part by the experience of operators with, or perceptions of, unsatisfactory performance by prior models of heavy-duty natural gas truck engines, actual or perceived insufficiencies in the financial incentives to convert, and improvements in diesel engine technology. If these conditions continue, then the growth levels in this market will continue to be low. We believe the newest models of heavy-duty natural gas truck engines have substantially addressed concerns with prior models. To the extent these or other factors have contributed to curtailed demand or slowing growth in the market for our vehicle fuels, we believe they have also contributed to decreases in station construction activity in certain periods, as the success of this activity is dependent on the success of the market for our vehicle fuels generally. Moreover, we believe these factors have materially contributed to the volatility and declines in our stock price and market capitalization in recent years, which has and could in the future lead to decreased cash flows and indications of asset or goodwill impairment. If these adverse macroeconomic conditions and other uncertainties in our industry persist, our financial results and stock price may continue to be adversely affected. |
In spite of these market conditions, we believe our key customer markets, including heavy-duty trucking, airports, refuse, and public transit, are well-suited for the adoption of our vehicle fuels because they consume relatively high volumes of fuel, refuel at centralized locations or along well-defined routes and/or are facing increasingly stringent emissions or other environmental requirements. We also expect the lower GHG emissions associated with our RNG vehicle fuel will result in increased demand for this fuel, resulting in our continued delivery of increasing volumes of RNG to our vehicle fleet customers. Additionally, we anticipate that, over time, cities and communities in the U.S. and Canada will follow large cities in Europe in banning diesel vehicles. If these projections materialize, we believe there will be growth in the consumption of our vehicle fuels in our key customer and geographic markets, and our goal is to capitalize on this growth if and when it materializes. In that event, we expect our operating costs and capital expenditures would increase in connection with any growth of our business in the future.
Our Performance
Overview. Our gross revenue mostly consists of volume-related product and service revenue and station construction sales. Our revenue can vary between periods due to a variety of factors, including, among others, the amount and timing of vehicle fuel sales, natural gas commodity prices, station construction sales, sales of Environmental Credits, and recognition of government credits, grants and incentives, such as AFTC, which expired on December 31, 2024 and has not been renewed. In addition, our volume-related product revenue has been subject to fluctuations as a result of our entry into certain commodity swap arrangements in October 2018 and ended in June 2024, because the changes in fair value of these and certain other derivative instruments, including existing and anticipated fueling contracts under our Zero Now truck financing program, are included in volume-related product revenue. Furthermore, our volume-related product revenue has been affected by the Amazon Warrant Charges resulting from immediate vesting of a portion of the Amazon Warrant and subsequent vesting associated with fuel purchases made by Amazon and its affiliates.
Our cost of sales can also vary between periods due to a variety of factors, including fluctuations in natural gas commodity prices, station construction and labor costs, as well as the other factors that impact our revenue levels described above.
In addition, our performance in certain periods has been affected by transactions or events that have resulted in significant cash or non-cash gains or losses. Such gains or losses may not recur regularly, in the same amounts or at all in future periods and, with respect to non-cash gains and losses, do not impact our liquidity.
These significant fluctuations in our operating results may render period-to-period comparisons less meaningful, especially given the current uncertainties relating to macro-economic growth and inflation trends, and investors in our securities should not rely on the results of one period as an indicator of performance in any other period. Additionally, these fluctuations in our operating results could cause our performance in any period to fall below the financial guidance we may have provided to the public or the estimates and projections of the investment community, which could negatively affect the price of our common stock.
See “Results of Operations” below for more information about our performance in 2023 and 2024.
41
Fuel Volume. The amount of RNG and conventional natural gas, in the form of CNG and LNG, that we sold increased by 3.3% from 2023 to 2024 primarily due to an increase in economic activities and travel generally and growth in our key customer markets.
The amount of RNG we sell as vehicle fuel, which is delivered in the form of CNG or LNG, has continued to experience robust growth, and increased by 4.9% from 2023 to 2024. We believe the increased demand for RNG is attributable to the belief in the dramatic reduction in the amount of climate-harming GHG that can be achieved through the use of RNG and pressure from politicians, regulators, non-governmental organizations and the investment community directed at companies to reduce their contributions to GHG emissions. To the extent demand for RNG continues to increase, we expect our joint ventures with TotalEnergies and bp and our expanded supply agreements to increase our volume-related product revenue due to increased volumes of RNG vehicle fuel sold and increased generation of RINs and LCFS Credits. In addition, such an increase in RNG demand could also result in more robust competition for supplies of RNG, including from other vehicle fuel providers, gas utilities (which may have distinct advantages in accessing RNG supply, including potential use of ratepayer funds to fund RNG purchases if approved by a utility’s regulatory commission) and other users and providers. We expect to invest in production projects to help ensure that we have adequate supply of RNG, and we are pursuing development and ownership of livestock waste ADG projects on our own and with partners including TotalEnergies and bp.
Environmental Credits. When we sell RNG for use as a vehicle fuel, we are eligible to generate RINs and LCFS Credits, which we then seek to sell to third parties.
The markets for RINs and LCFS Credits have been volatile and unpredictable in recent periods, and the prices for these credits have been subject to significant fluctuations. For example, in 2024, market prices for RINs have been as high as $3.57 and as low as $2.08. Additionally, the value of RINs and LCFS Credits, and consequently the revenue levels we may receive from our sale of these credits, may be adversely affected by changes to the federal and state programs under which these credits are generated and sold, prices for and use of oil, diesel or gasoline, the inclusion of additional qualifying fuels in the programs, increased production levels of other fuels in the programs, or other conditions. See the risks discussed under “Our business is influenced by environmental, tax and other government regulations, programs and incentives that promote our vehicle fuels, and their modification or repeal could negatively affect our business,” in Part I, Item 1A of this report for more information. Further, our ability to generate revenue from sales of these credits depends on our strict compliance with these federal and state programs, which are complex and can involve a significant degree of judgment. If the agencies that administer and enforce these programs disagree with our judgments, otherwise determine we are not in compliance, conduct reviews of our activities or make changes to the programs, then our ability to generate or sell these credits could be temporarily restricted pending completion of reviews or as a penalty, permanently limited or lost entirely, and we could be subject to fines or other sanctions. Any of these outcomes could force us to purchase credits in the open market to cover any credits we have contracted to sell, retire credits we may have generated but not yet sold, reduce or eliminate a significant revenue stream or incur substantial additional and unplanned expenses.
Risk Management Activities
From time to time, we enter into fuel sales contracts that require us to sell CNG or LNG to our customers at a fixed price. These contracts expose us to the risk that the price of natural gas commodity may increase above the natural gas commodity cost component included in the price at which we are committed to sell the natural gas to our customers.
In an effort to mitigate the volatility of our earnings related to any futures contracts and to reduce our risk related to our fixed price sales contracts, we operate under a policy pursuant to which we purchase future physical delivery, fixed price contracts to hedge our exposure to variability in expected future cash flows related to a particular fixed price contract or bid. Subject to the conditions set forth in the policy, we purchase physical delivery fixed price contracts in quantities reasonably expected to effectively hedge our exposure to cash flow variability related to fixed price sales contracts entered into after the date of the policy.
Unless otherwise agreed in advance by our Board of Directors and the derivatives committee thereof, we will conduct our futures contract activities and enter into fixed price sales contracts only in accordance with our policy.
42
Due to the restrictions of our policy, we expect to offer few fixed price sales contracts to our customers. If we do offer a fixed price sales contract, we anticipate including a price component that would cover our estimated cash requirements over the duration of the future physical delivery fixed price contracts. The amount of this price component will vary based on the anticipated volume and the natural gas price component to be covered under the fixed price sales contract.
In October 2018, in support of our Zero Now truck financing program, we executed two commodity swap contracts with TotalEnergies Gas & Power North America, an affiliate of TotalEnergies, for a total of five million diesel gallons annually from April 1, 2019 to June 30, 2024. These commodity swap contracts were intended to manage risks related to the diesel-to-natural gas price spread in connection with the natural gas fuel supply commitments we have made and expect to make in our current and anticipated fueling agreements with fleet operators that participate in the Zero Now program.
Critical Accounting Policies and Estimates
This discussion is based upon our consolidated financial statements included in this report, which have been prepared in accordance with accounting principles generally accepted in the United States of America (“U.S. GAAP”). The preparation of consolidated financial statements in conformity with U.S. GAAP requires management to make estimates and assumptions that affect the amounts reported in the consolidated financial statements and accompanying notes. Actual results could differ from those estimates and may result in material effects on our operating results and financial position.
We believe the critical accounting policies discussed below affect our more significant estimates made in preparing our consolidated financial statements. See Notes 1 and 2 for more information about these and our other significant accounting policies.
Revenue Recognition
In general, revenue is recognized when control of the promised goods or services is transferred to our customers, in an amount that reflects the consideration to which we expect to be entitled in exchange for the goods or services. To achieve that core principle, a five-step approach is applied: (1) identify the contract with a customer, (2) identify the performance obligations in the contract, (3) determine the transaction price, (4) allocate the transaction price to the performance obligations in the contract, and (5) recognize revenue allocated to each performance obligation when we satisfy the performance obligation. A performance obligation is a promise in a contract to transfer a distinct good or service to the customer and is the unit of account for revenue recognition.
We recognize revenue on various products and services.
Our volume-related product revenue consists of sales of RNG and conventional natural gas, in the form of CNG and LNG, AFTC incentives, and sales of RINs and LCFS Credits in addition to Amazon Warrant Charges (as defined in Note 12) and changes in fair value of our derivative instruments.
RNG and conventional natural gas are sold pursuant to contractual commitments over defined delivery periods. These contracts typically include a stand-ready obligation to supply natural gas. We recognize fuel revenue in the amount to which we have the right to invoice. We have a right to consideration based on the amount of GGEs of fuel dispensed by the customer and current pricing conditions. Customers are typically billed on a monthly basis. Since payment terms are less than a year, we have elected the practical expedient which allows us to not assess whether a customer contract has a significant financing component.
Our service revenue consists of sales of O&M and other services. O&M and other services are sold pursuant to contractual commitments over defined performance periods. These contracts typically include a stand-ready obligation to provide O&M and/or other services based on a committed and agreed upon routine maintenance schedule or when and if called upon by the customer.
43
We recognize O&M and other services revenue in the amount to which we have the right to invoice. We have a right to consideration based on services rendered or on the amount of GGEs of fuel dispensed by the customer multiplied by an agreed-upon rate. Customers are typically billed on a monthly basis. Since payment terms are less than a year, we have elected the practical expedient which allows us to not assess whether a customer contract has a significant financing component.
We sell RIN Credits and LCFS Credits to third parties that need the credits to comply with federal and state requirements. Revenue is recognized on these credits when there is an agreement in place to monetize the credits at a determinable price and the RNG fuel has been sold. The sales price for some environmental credit transactions may not be determinable in the period during which the RNG was sold as pricing is established in the quarter after the RNG was sold. In these circumstances, revenue from RIN and LCFS credits is recognized once the sales price has been established and therefore is considered determinable.
Changes in fair value of derivative instruments relates to our commodity swap and certain customer fueling contracts under our Zero Now truck financing program. The contracts are measured at fair value with changes in the fair value recorded in our consolidated statements of operations in the period incurred. The amounts are classified as revenue because our commodity swap contracts are used to economically offset the risk associated with the diesel-to-natural gas price spread resulting from existing and anticipated customer fueling contracts under our Zero Now truck financing program.
Amazon Warrant Charges are determined based on the grant date fair value of the award, and the associated non-cash stock-based sales incentive charges, which are recorded as a reduction of revenue, are recognized as the customer purchases fuel and vesting conditions become probable of being achieved. See Note 1 for additional information.
Station construction contracts are generally short-term, except for certain larger and more complex stations, which can take up to 24 months to complete. For most of our station construction contracts, the customer contracts with us to provide a significant service of integrating a complex set of tasks and components into a single station. Hence, the entire contract is accounted for as one performance obligation.
We recognize station construction revenue over time as we perform under these contracts because of the continual transfer of control of the goods to the customer, who typically controls the work in process. Revenue is recognized based on the extent of progress towards completion of the performance obligation and is recorded proportionally as costs are incurred. Costs to fulfill our obligations under these contracts typically include labor, materials and subcontractors’ costs, other direct costs and an allocation of indirect costs.
Refinements of estimates to account for changing conditions and new developments are continuous and characteristic of the process. Many factors that can affect contract profitability may change during the performance period of the contract, including differing site conditions, the availability of skilled contract labor, the performance of major suppliers and subcontractors, and unexpected changes in material costs. Because a significant change in one or more of these estimates could affect the profitability of these contracts, the contract price and cost estimates are reviewed periodically as work progresses and adjustments proportionate to the cost-to-cost measure of progress are reflected in contract revenues in the reporting period when such estimates are revised as discussed above. Provisions for estimated losses on uncompleted contracts are recorded in the period in which the losses become known.
In certain contracts with our customers, we agree to provide multiple goods or services, including construction of and sale of a station, O&M services, and sale of fuel to the customer. These contracts have multiple performance obligations because the promise to transfer each separate good or service is separately identifiable and distinct. This evaluation requires significant judgment and the decision to combine a group of contracts or separate the combined or single contract into multiple performance obligations could change the amount of revenue recognized in one or more periods.
We allocate the contract price to each performance obligation using best estimates of the standalone selling price of each distinct good or service in the contract. The primary method used to estimate the standalone selling price for fuel and O&M services is observable standalone sales, and the primary method used to estimate the standalone selling price for station construction sales is the expected cost plus a margin approach because we sell customized customer-specific
44
solutions. Under this approach, we forecast expected costs of satisfying a performance obligation and then add an appropriate margin for the good or service.
AFTC is considered variable consideration because it can either increase or decrease the transaction price based on volumes of vehicle fuel sold. Additionally, AFTC is not recognized as revenue until it is authorized through federal legislation, which also provides a determinable price. We recognize revenue in the period the credit is authorized through federal legislation.
We collect and remit taxes assessed by various governmental authorities that are imposed on and concurrent with revenue-producing transactions between us and our customers. These taxes may include, among others, fuel, sales and value-added taxes. We report the collection of these taxes on a net basis and they are excluded from revenue and cost of sales.
Fair Value Measurements
We have established a framework that follows the authoritative guidance for fair value measurements with respect to assets and liabilities that are measured at fair value on a recurring basis and non-recurring basis. Under the framework, fair value is defined as the exit price, or the amount that would be received to sell an asset or paid to transfer a liability in an orderly transaction between market participants, as of the measurement date. The framework also establishes a hierarchy for inputs used in measuring fair value that maximizes the use of observable inputs and minimizes the use of unobservable inputs by requiring that the most observable inputs be used when available. Observable inputs are inputs market participants would use in valuing the asset or liability and are developed based on market data obtained from sources independent of our Company. Unobservable inputs are inputs that reflect our assumptions about the factors market participants would use in valuing the asset or liability and are developed based upon the best information available in the circumstances. The hierarchy consists of the following three levels: Level 1 inputs are quoted prices (unadjusted) in active markets for identical assets or liabilities; Level 2 inputs include quoted prices for similar assets or liabilities in active markets, quoted prices for identical or similar assets or liabilities in markets that are not active, and inputs (other than quoted prices) that are observable for the asset or liability, either directly or indirectly; Level 3 inputs are unobservable inputs for the asset or liability. Categorization within the valuation hierarchy is based upon the lowest level of input that is significant to the fair value measurement.
Impairment of Goodwill and Long-Lived Assets
Goodwill represents the excess of costs incurred over the fair value of the net assets of acquired businesses. We assess our goodwill using either a qualitative or quantitative approach to determine whether it is more likely than not that the fair value of our reporting unit is less than its carrying value. We are required to use judgment when applying the goodwill impairment test, including, among other considerations, the identification of reporting unit(s), the assessment of qualitative factors, and the estimation of fair value of a reporting unit in the quantitative approach. We determined that we are a single reporting unit for the purpose of performing the goodwill impairment test. We perform the impairment test annually on October 1st, or more frequently if facts or circumstances change that would indicate that the carrying amount may be impaired.
The qualitative goodwill assessment includes the potential effect on a reporting unit’s fair value of certain events and circumstances, including its enterprise value, macroeconomic conditions, industry and market considerations, cost factors, and other relevant entity-specific events. If it is determined, based upon the qualitative assessment, that it is more likely than not that the reporting unit’s fair value is less than its carrying amount, then a quantitative impairment test is performed. Alternatively, we may bypass the qualitative assessment for a reporting unit and directly perform the quantitative goodwill impairment test.
The quantitative goodwill impairment test estimates the reporting unit's fair value based on its market value of invested capital plus a market participant acquisition premium derived from recent merger and acquisition transactions in comparable industry and market sectors as those in which the Company operates. The estimates, including the estimation methodology, used to determine the fair value of the reporting unit may change based on results of operations,
45
macroeconomic conditions, stock price fluctuations or other factors. Changes in these estimates could materially affect our assessment of the fair value and goodwill impairment for the reporting unit.
In 2024, we bypassed the qualitative assessment and directly perform the quantitative goodwill impairment test on October 1, 2024, for our single reporting unit, as described above, due to a decline in the market price of our common stock, which resulted in a fair value, based on its market value of invested capital plus a market participant acquisition premium, that exceeded carrying value by 16% or $165.1 million.
Due to a decline in the market price of our common stock subsequent to October 1, 2024, we performed an interim quantitative goodwill impairment test as of December 31, 2024 for our single reporting unit as described above, which resulted in a fair value, based on its market value of invested capital plus a market participant acquisition premium, that exceeded carrying value by 4% or $39.8 million.
Since December 31, 2024, our stock price has increased from the price at December 31, 2024, increasing our market capitalization. As such, we determined that declines experienced in 2024 are not currently sustained. We have not identified other events or circumstances that would more likely than not reduce the fair value of our reporting unit to below its carrying value on a sustained basis. As such, we believe the reporting unit’s goodwill as of December 31, 2024 was not impaired. It is possible that our goodwill could become impaired if we determine in a subsequent period that the fair value of our reporting unit was less than its carrying amount on a sustained basis, which could result in a material charge and adversely affect our results of operations.
We had also performed interim quantitative goodwill impairment tests as of March 31, 2024, June 30, 2024, and September 30, 2024 for the single reporting unit. Each of the tests performed indicated that the fair value of the reporting unit exceeded its carrying value.
We review the carrying value of our long-lived assets, including property and equipment and intangible assets with finite useful lives, for impairment whenever events or changes in circumstances indicate that the carrying value of an asset or asset group may not be recoverable. Events that could result in an impairment review include, among others, a significant decrease in the operating performance of a long-lived asset or asset group or the decision to close a fueling station. Impairment testing involves a comparison of the sum of the undiscounted future cash flows of the asset or asset group to its carrying amount. If the sum of the undiscounted future cash flows exceeds the carrying amount, then no impairment exists. If the carrying amount exceeds the sum of the undiscounted future cash flows, then a second step is performed to determine the amount of impairment, if any, to be recognized. An impairment loss is recognized to the extent that the carrying amount of the asset or asset group exceeds its fair value. The fair value of the asset or asset group is based on estimated discounted future cash flows of the asset or asset group using a discount rate commensurate with the related risk. The estimate of future cash flows requires management to make assumptions and to apply judgment, including forecasting future sales and expenses and estimating useful lives of the assets. These estimates can be affected by a number of factors, including, among others, future results, demand and economic conditions, many of which can be difficult to predict.
Recently Adopted Accounting Pronouncements and Recently Issued Accounting Pronouncements.
See Note 1 for information about recently adopted accounting pronouncements and recently issued accounting pronouncements.
Results of Operations
The discussions below compare our results of operations in 2024 and 2023. Historical results are not indicative of the results to be expected in the current period or any future period.
46
2024 Compared to 2023
The table below presents, for each period, each line item of our statement of operations as a percentage of our total revenue for the period. The narrative that follows provides a comparative discussion of certain of these line items between periods.
Year Ended |
|
||||
December 31, |
|||||
|
|
2023 |
|
2024 |
|
Statements of Operations Data: |
|
|
|
|
|
Revenue: |
|
|
|
|
|
Product revenue |
|
87.0 |
% |
85.8 |
% |
Service revenue |
|
13.0 |
|
14.2 |
|
Total revenue |
|
100.0 |
|
100.0 |
|
Operating expenses: |
|
|
|
|
|
Cost of sales (exclusive of depreciation and amortization shown separately below): |
|
|
|
|
|
Product cost of sales |
|
72.9 |
|
60.0 |
|
Service cost of sales |
|
7.9 |
|
9.1 |
|
Selling, general and administrative |
|
26.4 |
|
26.9 |
|
Depreciation and amortization |
|
10.7 |
|
10.8 |
|
Impairment of Investments in Equity Securities |
|
— |
|
1.9 |
|
Total operating expenses |
|
117.9 |
|
108.7 |
|
Operating loss |
|
(18.0) |
|
(8.7) |
|
Interest expense |
|
(5.4) |
|
(7.7) |
|
Interest income |
|
2.6 |
|
3.4 |
|
Other income (expense), net |
|
— |
|
— |
|
Loss from equity method investments |
|
(2.9) |
|
(6.4) |
|
Loss before income taxes |
|
(23.7) |
|
(19.4) |
|
Income tax (expense) benefit |
|
0.1 |
|
(0.6) |
|
Net loss |
|
(23.6) |
|
(20.0) |
|
Loss attributable to noncontrolling interest |
|
0.1 |
|
0.1 |
|
Net loss attributable to Clean Energy Fuels Corp. |
|
(23.5) |
% |
(19.9) |
% |
Product revenue. Product revenue for 2024 decreased by $13.1 million to $356.7 million, representing 85.8% of total revenue, compared to $369.8 million, representing 87.0% of total revenue, for 2023. The decrease was primarily due to lower average prices on fuel sold driven by a decrease in the prices of natural gas, along with a $0.2 million increase in non-cash stock-based sales incentive contra-revenue charges relating to the Amazon Warrant driven by higher customer fuel purchases, partially offset by an increase in total GGEs of fuel sold, resulting in a $28.1 million net decrease in fuel sales in 2024 compared to 2023. In addition, a decrease in station construction sales of $1.2 million resulting from decreased construction activities also contributed to the decrease in product revenue in 2024 compared to 2023. The decrease in product revenue between periods was partially offset by (1) an increase in RIN revenue of $13.1 million primarily resulting from higher average RIN prices and higher share of RIN values in 2024 when compared to those in 2023, (2) an increase in AFTC revenue of $2.9 million due to higher fuel volumes in 2024 compared to 2023, (3) an increase in LCFS revenue of $0.1 million primarily resulting from increased LCFS revenue sharing with customers in 2024 when compared to those in 2023, partially offset by lower average LCFS prices, and (4) a change in fair value of our commodity swap and customer contracts entered into in connection with our Zero Now truck financing program, as we recognized an unrealized loss of $0.1 million in 2024 compared to an unrealized loss of $0.2 million in 2023.
Service revenue. Service revenue for 2024 increased $3.9 million to $59.2 million, representing 14.2% of total revenue, compared to $55.3 million, representing 13.0% of total revenue, for 2023. The increase was primarily due to an increase in GGEs serviced in 2024 when compared to those in 2023.
Product cost of sales. Product cost of sales for 2024 decreased by $60.3 million to $249.6 million, representing 60.0% of total revenue, from $309.9 million, representing 72.9% of total revenue, in 2023. The decrease was primarily due to
47
lower average prices of natural gas in 2024 compared to 2023. In 2023, there was a significant rise in cost of natural gas in California during January and February. The effects of lower natural gas prices in 2024 were partially offset by an increase in GGEs of fuel sold.
Service cost of sales. Service cost of sales for 2024 increased by $4.2 million to $37.9 million, representing 9.1% of total revenue, from $33.7 million, representing 7.9% of total revenue, in 2023. The increase was primarily due to an increase in GGEs serviced in 2024 when compared to those serviced in 2023.
Selling, general and administrative. Selling, general and administrative expenses decreased by $0.5 million to $111.8 million in 2024, from $112.3 million in 2023. The decrease was mostly driven by a $12.5 million decrease in stock-based compensation expense due to current year vesting and forfeiture of equity awards granted in prior years, partially offset by equity awards granted in the current year, partially offset by a $5.4 million increase in salaries and benefits as a result of higher headcount and a $6.6 million increase in general business, selling and administrative expenses.
Depreciation and amortization. Depreciation and amortization decreased by $1.0 million to $44.7 million in 2024, from $45.7 million in 2023. The decrease was primarily due to more assets being fully depreciated partially offset by higher amount of depreciable assets.
Impairment of Investments in Equity Securities. Impairment of Investments in equity securities increased by $8.1 million to $8.1 million in 2024, from $0.0 million in 2023. The impairment was primarily due to the investee’s deteriorating financial results in late 2024.
Interest expense. Interest expense increased by $9.3 million to $32.2 million in 2024 from $22.9 million in 2023, primarily due to (1) a 11.5 million increase due to higher outstanding indebtedness, (2) a $3.2 million increase due to higher amortization of debt discount and issuance costs, partially offset by a $5.4 million debt extinguishment loss relating to extinguishment of the Sustainability-Linked Term Loan pursuant to the Riverstone Credit Agreement (each as defined and described in Note 11 to the note to consolidated financial statements) in 2023.
Interest income. Interest income increased by $2.9 million to $14.0 million in 2024 from $11.1 million in 2023, primarily due to higher average interest rates of the Company’s short-term investments and loan receivables.
Loss from equity method investments. Loss from equity method investments increased by $14.1 million to $26.6 million in 2024 from $12.5 million in 2023, due to the operating results of SAFE S.p.A., Rimere and our joint venture(s) with TotalEnergies and bp, and our other equity method investees.
Income tax (expense) benefit. Income tax expense was $2.7 million in 2024 compared to income tax benefit of $0.4 million in 2023. Income tax expense and/or benefit is primarily related to deferred taxes associated with goodwill and other indefinite-lived deferred tax liabilities, and the Company’s expected state tax expense.
Loss attributable to noncontrolling interest. In 2024 and 2023, we recorded a gain of $0.6 million and $0.6 million, respectively, for the noncontrolling interest in the net loss of NG Advantage. The noncontrolling interest in NG Advantage represents a 6.7% minority interest that was held by third parties during both the 2024 and 2023 periods.
Seasonality and Inflation
To some extent, we experience seasonality in our results of operations. Some of our customers tend to consume more of our vehicle fuels in the summer months, when buses and other fleet vehicles use more fuel to power their air conditioning systems, which typically translate to an increased volume of fuel sold in the summer months. In addition, natural gas commodity prices tend to be higher in the fall and winter months, due to increased overall demand for natural gas for heating during these periods.
Historically, inflation has not significantly affected our operating results; however, costs for construction, repairs, maintenance, electricity and insurance are all subject to inflationary pressures, which could affect our ability to maintain
48
our stations adequately, build new stations, expand our existing facilities or pursue additional facilities, and could materially impact our operating costs.
Liquidity and Capital Resources
Liquidity
Liquidity is the ability to meet present and future financial obligations through operating cash flows, the sale or maturity of investments or the acquisition of additional funds through capital management. Our financial position and liquidity are, and will continue to be, influenced by a variety of factors, including the level of our outstanding indebtedness and the principal and interest we are obligated to pay on our indebtedness; the amount and timing of any capital calls related to the joint venture(s) with TotalEnergies and/or bp, or any other joint venture we may enter into in the future; the amount and timing of any additional debt or equity financing we may pursue; our capital expenditure requirements; any merger, divestiture or acquisition activity; and our ability to generate cash flows from our operations. We expect cash provided by our operating activities to fluctuate as a result of a number of factors, including our operating results and the factors that affect these results, including the amount and timing of our vehicle fuel sales, station construction sales, sales of RINs and LCFS Credits and recognition of government credits, grants and incentives, if any; fluctuations in commodity, station construction and labor costs; supply chain issues and unfavorable macroeconomic events, including inflationary pressures; environmental credit prices; variations in the fair value of certain of our derivative instruments that are recorded in revenue; and the amount and timing of our billing, collections and liability payments.
Cash Flows
Operating Activities. Cash provided by operating activities was $64.6 million in 2024, compared to cash provided by operating activities of $43.8 million in 2023. The increase in cash provided by operating activities in 2024 was primarily attributable to higher contributions relating to the procurement and sales of natural gas in 2024 compared to that in 2023. The increase is partially offset by higher net cash interest payments and changes in working capital resulting from the timing of cash receipts, accruals, billings and payments of cash.
Investing Activities. Cash used in investing activities was $77.7 million in 2024, compared to cash used in investing activities of $202.0 million in 2023. The decrease in cash used in investing activities in 2024 was primarily attributable to a $48.4 million increase in net maturities of short-term investments in 2024 when compared to that in 2023, a $44.4 million net decrease in capital expenditures on property and equipment and on RNG production projects, and a $40.6 million decrease in investments in other entities. The decrease is partially offset by an $8.8 million increase in net disbursements for loans receivables.
Financing Activities. Cash used in financing activities was $1.9 million in 2024, compared to $139.1 million provided by financing activities in 2023. The change between periods was primarily attributable to proceeds received from the issuance of debt in connection with the Stonepeak Credit Agreement (Note 11) in 2023, while there were no such debt issuance activities in 2024.
Capital Expenditures, Indebtedness and Other Uses of Cash
We require cash to fund our capital expenditures, operating expenses and working capital and other requirements, including costs associated with fuel sales; outlays for the design and construction of new fueling stations; additions or other modifications to existing fueling stations; RNG production facilities; debt repayments and repurchases; repurchases of common stock; purchases of heavy-duty trucks that use our fuels; additions or modifications of LNG production facilities; supporting our operations, including maintenance and improvements of our infrastructure; supporting our sales and marketing activities, including support of legislative and regulatory initiatives; financing vehicles for our customers; any investments in other entities; any mergers or acquisitions, including acquisitions to expand our RNG production capacity; pursuing market expansion as opportunities arise, including geographically and to new customer markets; and to fund other activities or pursuits and for other general corporate purposes.
Our business plan calls for approximately $30.0 million in capital expenditures in 2025. These capital expenditures primarily relate to the construction of fueling stations, IT software and equipment and LNG plant costs, and we expect to
49
fund these expenditures primarily through cash on hand and cash generated from operations. Further, in 2025, we anticipate deploying up to approximately $104.0 million to develop ADG RNG production facilities. As of December 31, 2024, we have invested $321.8 million in the development of ADG RNG production facilities, which includes $271.9 million contributed to our joint ventures.
We had total indebtedness, consisting of our debt and finance leases, of approximately $302.9 million in principal amount as of December 31, 2024, of which approximately $1.0 million, $0.9 million, $0.7 million, $0.3 million, $300.0 million and $0.0 million are expected to become due in 2025, 2026, 2027, 2028, 2029 and thereafter, respectively. Based on our outstanding indebtedness and applicable interest rates as of December 31, 2024, we expect our total interest payment obligations relating to our indebtedness to be approximately $29.1 million for the year ending December 31, 2025. We plan to and believe we are able to make all expected principal and interest payments in the next 12 months.
We also have indebtedness, including the amount representing interest, from our operating leases of approximately $149.2 million as of December 31, 2024, of which approximately $16.7 million, $16.6 million, $16.6 million, $15.8 million, $15.1 million and $68.4 million are expected to become due in 2025, 2026, 2027, 2028, 2029 and thereafter, respectively.
We intend to make payments under our various debt instruments when due and pursue opportunities for earlier repayment and/or refinancing if and when these opportunities arise. Although we believe we have sufficient liquidity and capital resources to repay our debt coming due in the next 12 months, we may elect to suspend, or limit repurchases under, our share repurchase program or pursue alternatives, such as refinancing, or debt or equity offerings, to increase our cash management flexibility.
Sources of Cash
Historically, our principal sources of liquidity have consisted of cash on hand, cash provided by our operations, including, if available, AFTC and other government credits, grants and incentives, cash provided by financing activities, and sales of assets. As of December 31, 2024, excluding current portion of restricted cash, we had total cash and cash equivalents and short-term investments of $217.5 million, compared to $263.1 million as of December 31, 2023.
We expect cash provided by our operating activities to fluctuate depending on our operating results, which can be affected by the factors described above, such as the non-renewal of AFTC, as well as the other factors described in this MD&A and Item 1A. “Risk Factors” of this report.
Subject to the following paragraph, we believe our cash and cash equivalents and short-term investments and anticipated cash provided by our operating and current or future financing activities will satisfy our expected business requirements for at least the 12 months following the date of this report. Subsequent to that period, we may need to raise additional capital to fund any planned or unanticipated capital expenditures, investments, debt repayments, share repurchases or other expenses that we cannot fund through cash on-hand, cash provided by our operations or other sources. Moreover, we may use our cash resources faster than we predict due to unexpected expenditures or higher-than-expected expenses due to unfavorable macroeconomic events, including inflationary pressures or otherwise, in which case we may need to seek capital from alternative sources sooner than we anticipate. The timing and necessity of any future capital raise would depend on various factors, including our rate and volume of, and prices for, natural gas fuel sales and other volume-related activity, new station construction, debt repayments (either before or at maturity) and any potential mergers, acquisitions, investments, divestitures or other strategic relationships we may pursue, as well as the other factors that affect our revenue and expense levels as described in this MD&A and elsewhere in this report.
If we deploy additional capital to develop ADG RNG production facilities and fueling stations to support contracted RNG fueling volume, we could be required to raise additional capital.
We may raise additional capital through one or more sources, including, among others, obtaining equity capital, including through offerings of our common stock or other securities, obtaining new or restructuring existing debt, selling assets, or any combination of these or other potential sources of capital. We may not be able to raise capital when needed, on terms that are favorable to us or our stockholders or at all. Any inability to raise necessary capital may impair our ability
50
to develop and maintain fueling infrastructure, invest in strategic transactions or acquisitions or repay our outstanding indebtedness and may reduce our ability to support and build our business and generate sustained or increased revenue.
Material Cash Requirements
The table below presents our material cash requirements, including the scheduled maturities of our contractual obligations and our commitments for capital expenditures as of December 31, 2024. This table excludes certain potential cash requirements because they may involve future cash payments that are considered uncertain and cannot be estimated because they vary based upon future conditions; however, the exclusion of these obligations should not be construed as an implication that they are immaterial, as they could significantly affect our short- and long-term liquidity and capital resource needs depending on a variety of future events, facts and conditions.
Payments Due by Period |
|||||||||||||||
Less than |
More than |
||||||||||||||
Contractual Obligations: (in thousands) |
|
Total |
|
1 year |
|
1 - 3 years |
|
3 - 5 years |
|
5 years |
|||||
Long-term debt (1) |
$ |
443,302 |
$ |
28,960 |
$ |
57,933 |
$ |
356,409 |
$ |
— |
|||||
Finance lease obligations (2) |
3,110 |
1,143 |
|
1,725 |
|
242 |
|
— |
|||||||
Operating lease commitments (3) |
|
149,233 |
|
16,663 |
33,229 |
30,925 |
68,416 |
||||||||
Long-term take-or-pay contracts (4) |
|
1,463 |
|
1,463 |
|
— |
|
— |
|
— |
|||||
Construction contracts (5) |
|
17,356 |
|
17,356 |
|
— |
|
— |
|
— |
|||||
Capital expenditure for RNG project (6) |
24,997 |
24,997 |
— |
— |
— |
||||||||||
Total |
$ |
639,461 |
$ |
90,582 |
$ |
92,887 |
$ |
387,576 |
$ |
68,416 |
|||||
| (1) | Represents long-term debt, including future interest payments, to finance acquisitions, equipment purchases and development of RNG production projects. |
| (2) | Consist of finance lease obligations, including future interest payments, relating to financing of equipment purchases. |
| (3) | Represent various leases including ground leases for our Boron, California plant and fueling stations, property leases relating to our office spaces, and leases for equipment. |
| (4) | Represent estimated commitment relating to our long-term, quarterly natural gas purchase contracts with a take-or-pay commitment. |
| (5) | Consist of our obligations to fund various fueling station construction projects including our commitment to construct certain fueling stations in Canada pursuant to the Joint Development Agreement with Tourmaline of which 50% of the station construction costs is expected to be reimbursed by Tourmaline. The amount presented is net of amounts funded through December 31, 2024 and excludes contractual commitments relating to station sales contracts. |
| (6) | Represents our capital expenditure commitment to fund the development and construction of ADG RNG projects, net of amounts funded through December 31, 2024. The project is expected to be substantially complete in the third quarter of 2025. |
Off-Balance Sheet Arrangements
As of December 31, 2024, we had the following off-balance sheet arrangements that have had, or are reasonably likely to have, a material current or future effect on our financial condition, changes in financial condition, revenue or expenses, results of operations, liquidity, capital expenditures or capital resources:
| ● | Outstanding surety bonds for construction contracts and general corporate purposes totaling $93.8 million; |
| ● | A loan commitment to an equity method investee; |
| ● | Quarterly fixed-price natural gas purchase contracts with take-or-pay commitments, the amount of which is shown under “Contractual Obligations” above; |
| ● | One long-term natural gas sale contract with a fixed supply commitment. |
We provide surety bonds primarily for construction contracts in the ordinary course of our business, as a form of guarantee. No liability has been recorded in connection with our surety bonds because, based on historical experience and
51
available information, we do not believe it is probable that any amounts will be required to be paid under these arrangements for which we will not be reimbursed.
We entered into a note purchase agreement, dated January 8, 2024, with Rimere, an equity method investee, pursuant to which we committed to make available up to $10.0 million in delayed draw loans to support Rimere’s working capital requirements (see Note 18).
As of December 31, 2024, we had quarterly fixed-price natural gas purchase contracts with take-or-pay commitments extending through March 2025.
In addition, as of December 31, 2024, we had a fixed supply arrangement with UPS for the supply and sale of 170.0 million GGEs of RNG through March 2026.
Item 7A. Quantitative and Qualitative Disclosures about Market Risk.
In the ordinary course of our business, we are exposed to various market risks, including commodity price risks, risks related to foreign currency exchange rates, and risks related to fluctuations in interest rates.
Commodity Price Risk
We are subject to market risk with respect to our sales of natural gas, which have historically been subject to volatile market conditions. Our exposure to market risk is heightened when we have a fixed-price sales contract with a customer that is not covered by a futures contract, or when we are otherwise unable to pass through natural gas price increases to customers. Natural gas prices and availability are affected by many factors, including, among others, drilling activity, supply, weather conditions, overall economic conditions and foreign and domestic government regulations.
Natural gas costs represented $182.4 million, $190.6 million, and $124.0 million of our cost of sales in 2022, 2023, and 2024, respectively.
We have prepared a sensitivity analysis to estimate our exposure to price risk with respect to our commodity swap contracts. If the diesel-to-natural gas price spread were to fluctuate by 10% as of December 31, 2024, we would expect a corresponding fluctuation in the fair value of our commodity swap contracts of approximately $0.4 million.
Foreign Currency Exchange Rate Risk
For the year ended December 31, 2024, our primary exposure to foreign currency exchange rates relates to our Canadian operations that had certain outstanding accounts receivable and accounts payable denominated in Canadian dollar, which were not hedged.
We have performed a sensitivity analysis to estimate our exposure to market risk with respect to our monetary transactions denominated in a foreign currency. If the exchange rates on these assets and liabilities were to fluctuate by 10% from the rates as of December 31, 2024, we would expect a corresponding fluctuation in the value of the net assets to be $0.1 million.
Interest Rate Risk
As of December 31, 2024, we had no debt that bears a variable rate of interest. Certain LIBOR tenors were discontinued after 2021 with other London Inter-bank Offered Rate (“LIBOR”) tenors discontinued after June 2023. We intend to monitor the developments with respect to the discontinuance of LIBOR and work with our lenders to minimize the effect of such a discontinuance on our financial condition and results of operations. To date, the effect of the discontinuance of LIBOR on us and on our debt instruments has not been material. However, if our lenders have increased costs due to changes in LIBOR, we may experience potential increases in interest rates on our variable rate debt or fees on our fixed rate debt, which could adversely affect our interest expense, results of operations and cash flows.
52
Item 8. Financial Statements and Supplementary Data.
INDEX TO CONSOLIDATED FINANCIAL STATEMENTS
|
|
Page |
Consolidated Financial Statements |
||
Reports of Independent Registered Public Accounting Firm (PCAOB ID 185) |
54 |
|
57 |
||
58 |
||
59 |
||
60 |
||
61 |
||
62 |
||
Financial Statement Schedule |
||
113 |
53
Report of Independent Registered Public Accounting Firm
To the Stockholders and Board of Directors
Clean Energy Fuels Corp.:
Opinion on the Consolidated Financial Statements
We have audited the accompanying consolidated balance sheets of Clean Energy Fuels Corp. and subsidiaries (the Company) as of December 31, 2024 and 2023, the related consolidated statements of operations, comprehensive loss, stockholders’ equity, and cash flows for each of the years in the three-year period ended December 31, 2024, and the related notes and financial statement schedule II (collectively, the consolidated financial statements). In our opinion, based on our audits and the report of Plante & Moran, PLLC, the consolidated financial statements present fairly, in all material respects, the financial position of the Company as of December 31, 2024 and 2023, and the results of its operations and its cash flows for each of the years in the three-year period ended December 31, 2024, in conformity with U.S. generally accepted accounting principles.
We also have audited, in accordance with the standards of the Public Company Accounting Oversight Board (United States) (PCAOB), the Company’s internal control over financial reporting as of December 31, 2024, based on criteria established in Internal Control – Integrated Framework (2013) issued by the Committee of Sponsoring Organizations of the Treadway Commission, and our report dated February 24, 2025 expressed an unqualified opinion on the effectiveness of the Company’s internal control over financial reporting.
We did not audit the consolidated financial statements for the year then ended December 31, 2022 of CE bp Renew Co, LLC a 50 percent owned investee company. The Company’s investment in CE bp Renew Co, LLC was $156.8 million as of December 31, 2022 and its loss from equity method investment of CE bp Renew Co, LLC was $2.7 million for the year then ended. The December 31, 2022 consolidated financial statements of CE bp Renew Co, LLC were audited by Plante & Moran, PLLC, whose report has been furnished to us, and our opinion, insofar as it relates to the amounts included for CE bp Renew Co, LLC, is based solely on the report of Plante & Moran, PLLC.
Basis for Opinion
These consolidated financial statements are the responsibility of the Company’s management. Our responsibility is to express an opinion on these consolidated financial statements based on our audits. We are a public accounting firm registered with the PCAOB and are required to be independent with respect to the Company in accordance with the U.S. federal securities laws and the applicable rules and regulations of the Securities and Exchange Commission and the PCAOB.
We conducted our audits in accordance with the standards of the PCAOB. Those standards require that we plan and perform the audit to obtain reasonable assurance about whether the consolidated financial statements are free of material misstatement, whether due to error or fraud. Our audits included performing procedures to assess the risks of material misstatement of the consolidated financial statements, whether due to error or fraud, and performing procedures that respond to those risks. Such procedures included examining, on a test basis, evidence regarding the amounts and disclosures in the consolidated financial statements. Our audits also included evaluating the accounting principles used and significant estimates made by management, as well as evaluating the overall presentation of the consolidated financial statements. We believe that our audits provide and the report of the other auditors provide a reasonable basis for our opinion.
Critical Audit Matter
The critical audit matter communicated below is a matter arising from the current period audit of the consolidated financial statements that was communicated or required to be communicated to the audit committee and that: (1) relates to accounts or disclosures that are material to the consolidated financial statements and (2) involved our especially challenging, subjective, or complex judgments. The communication of a critical audit matter does not alter in any way our opinion on the consolidated financial statements, taken as a whole, and we are not, by communicating the critical audit matter below, providing a separate opinion on the critical audit matter or on the accounts or disclosures to which it relates.
54
Goodwill impairment assessment
As discussed in Note 1 to the consolidated financial statements, the Company’s goodwill balance was $64,328 thousand as of December 31, 2024. The Company performs an impairment test annually on October 1, or more frequently if facts and circumstances warrant a review. For purposes of this test, the Company determined that it has a single reporting unit. Due to a decline in the market price of the Company’s common stock, the Company performed a quantitative impairment test as of December 31, 2024. For the quantitative goodwill impairment test, the Company estimated the fair value of its reporting unit based on its market value of invested capital plus a market participant acquisition premium derived from recent merger and acquisition transactions. The results of the quantitative goodwill impairment test performed as of December 31, 2024 indicated that the fair value of the Company’s reporting unit exceeded its carrying value, and as such, no impairment charges relating to goodwill were recorded.
We identified the evaluation of the fair value of the Company’s reporting unit as a critical audit matter. A high degree of subjective auditor judgment was required to evaluate management’s market participant acquisition premium used to estimate the fair value of the reporting unit. Specifically, evaluating the market participant acquisition premium involved subjective assessment of the selection of recent mergers and acquisitions. Additionally, changes to the market participant acquisition premium could have had a significant effect on the fair value of the reporting unit.
The following are the primary procedures we performed to address the critical audit matter. We evaluated the design and tested the operating effectiveness of certain internal controls related to the goodwill impairment process, including a control related to the estimation of the market participant acquisition premium and the selection of recent mergers and acquisitions. We involved valuation professionals with specialized skills and knowledge, who assisted in evaluating management’s market participant acquisition premium by comparing it against a market participant acquisition premium independently developed using publicly available third-party market data, including recent mergers and acquisitions, of comparable entities.
/s/ KPMG LLP
We have served as the Company’s auditor since 2001.
Irvine, California
February 24, 2025
Report of Independent Registered Public Accounting Firm
To the Stockholders and Board of Directors
Clean Energy Fuels Corp.:
Opinion on Internal Control Over Financial Reporting
We have audited Clean Energy Fuels Corp. and subsidiaries' (the Company) internal control over financial reporting as of December 31, 2024, based on criteria established in Internal Control – Integrated Framework (2013) issued by the Committee of Sponsoring Organizations of the Treadway Commission. In our opinion, the Company maintained, in all material respects, effective internal control over financial reporting as of December 31, 2024, based on criteria established in Internal Control – Integrated Framework (2013) issued by the Committee of Sponsoring Organizations of the Treadway Commission.
We also have audited, in accordance with the standards of the Public Company Accounting Oversight Board (United States) (PCAOB), the consolidated balance sheets of the Company as of December 31, 2024 and 2023, the related consolidated statements of operations, comprehensive loss, stockholders’ equity, and cash flows for each of the years in the three-year period ended December 31, 2024, and the related notes and financial statement schedule II (collectively, the consolidated financial statements), and our report dated February 24, 2025 expressed an unqualified opinion on those consolidated financial statements.
55
Basis for Opinion
The Company’s management is responsible for maintaining effective internal control over financial reporting and for its assessment of the effectiveness of internal control over financial reporting, included in the accompanying Management's Report on Internal Control Over Financial Reporting. Our responsibility is to express an opinion on the Company’s internal control over financial reporting based on our audit. We are a public accounting firm registered with the PCAOB and are required to be independent with respect to the Company in accordance with the U.S. federal securities laws and the applicable rules and regulations of the Securities and Exchange Commission and the PCAOB.
We conducted our audit in accordance with the standards of the PCAOB. Those standards require that we plan and perform the audit to obtain reasonable assurance about whether effective internal control over financial reporting was maintained in all material respects. Our audit of internal control over financial reporting included obtaining an understanding of internal control over financial reporting, assessing the risk that a material weakness exists, and testing and evaluating the design and operating effectiveness of internal control based on the assessed risk. Our audit also included performing such other procedures as we considered necessary in the circumstances. We believe that our audit provides a reasonable basis for our opinion.
Definition and Limitations of Internal Control Over Financial Reporting
A company’s internal control over financial reporting is a process designed to provide reasonable assurance regarding the reliability of financial reporting and the preparation of financial statements for external purposes in accordance with generally accepted accounting principles. A company’s internal control over financial reporting includes those policies and procedures that (1) pertain to the maintenance of records that, in reasonable detail, accurately and fairly reflect the transactions and dispositions of the assets of the company; (2) provide reasonable assurance that transactions are recorded as necessary to permit preparation of financial statements in accordance with generally accepted accounting principles, and that receipts and expenditures of the company are being made only in accordance with authorizations of management and directors of the company; and (3) provide reasonable assurance regarding prevention or timely detection of unauthorized acquisition, use, or disposition of the company’s assets that could have a material effect on the financial statements.
Because of its inherent limitations, internal control over financial reporting may not prevent or detect misstatements. Also, projections of any evaluation of effectiveness to future periods are subject to the risk that controls may become inadequate because of changes in conditions, or that the degree of compliance with the policies or procedures may deteriorate.
/s/ KPMG LLP
Irvine, California
February 24, 2025
56
CLEAN ENERGY FUELS CORP. AND SUBSIDIARIES
CONSOLIDATED BALANCE SHEETS
(In thousands, except share and per share data)
December 31, |
December 31, |
|||||
2023 |
2024 |
|||||
Assets |
||||||
Current assets: |
|
|
|
|
||
Cash, cash equivalents and current portion of restricted cash |
$ |
|
$ |
|
||
Short-term investments |
|
|
|
|
||
Accounts receivable, net of allowance of $ |
|
|
|
|
||
Other receivables |
|
|
|
|
||
Inventory |
|
|
|
|
||
|
|
|||||
Prepaid expenses and other current assets |
|
|
|
|
||
Total current assets |
|
|
|
|
||
Operating lease right-of-use assets |
|
|
||||
Land, property and equipment, net |
|
|
|
|
||
Notes receivable and other long-term assets, net |
|
|
|
|
||
Investments in other entities |
|
|
|
|
||
Goodwill |
|
|
|
|
||
Intangible assets, net |
|
|
|
|
||
Total assets |
$ |
|
$ |
|
||
Liabilities and Stockholders' Equity |
|
|
|
|
||
Current liabilities: |
|
|
|
|
||
Current portion of debt |
$ |
|
$ |
|
||
Current portion of finance lease obligations |
|
|
||||
Current portion of operating lease obligations |
|
|
||||
Accounts payable |
|
|
|
|
||
Accrued liabilities |
|
|
|
|
||
Deferred revenue |
|
|
|
|
||
Derivative liabilities, related party |
|
|
||||
Total current liabilities |
|
|
|
|
||
Long-term portion of debt |
|
|
||||
Long-term portion of finance lease obligations |
|
|
||||
Long-term portion of operating lease obligations |
|
|
||||
Other long-term liabilities |
|
|
|
|
||
Total liabilities |
|
|
|
|
||
Commitments and contingencies (Note 16) |
|
|
|
|
||
Stockholders’ equity: |
|
|
|
|
||
Preferred stock, $ |
|
|
|
|
||
Common stock, $ |
|
|
|
|
||
Additional paid-in capital |
|
|
|
|
||
Accumulated deficit |
|
( |
|
( |
||
Accumulated other comprehensive loss |
|
( |
|
( |
||
Total Clean Energy Fuels Corp. stockholders’ equity |
|
|
|
|
||
Noncontrolling interest in subsidiary |
|
|
|
|
||
Total stockholders’ equity |
|
|
|
|
||
Total liabilities and stockholders’ equity |
$ |
|
$ |
|
||
See accompanying notes to consolidated financial statements.
57
CLEAN ENERGY FUELS CORP. AND SUBSIDIARIES
CONSOLIDATED STATEMENTS OF OPERATIONS
(In thousands, except share and per share data)
Year Ended December 31, |
||||||||||
|
|
|
2022 |
|
2023 |
|
2024 |
|||
Revenue: |
|
|
|
|
|
|
|
|||
Product revenue |
$ |
|
$ |
|
$ |
|
||||
Service revenue |
|
|
|
|
|
|
||||
Total revenue |
|
|
|
|
|
|
||||
Operating expenses: |
|
|
|
|
|
|
||||
Cost of sales (exclusive of depreciation and amortization shown separately below): |
|
|
|
|
|
|
||||
Product cost of sales |
|
|
|
|
|
|
||||
Service cost of sales |
|
|
|
|
|
|
||||
Selling, general and administrative |
|
|
|
|
|
|
||||
Depreciation and amortization |
|
|
|
|
|
|
||||
Impairment of investments in equity securities |
|
|
|
|
|
|
||||
Total operating expenses |
|
|
|
|
|
|
||||
Operating loss |
|
( |
|
( |
|
( |
||||
Interest expense |
|
( |
|
( |
|
( |
||||
Interest income |
|
|
|
|
|
|
||||
Other income (expense), net |
|
|
|
|
|
|
||||
Loss from equity method investments |
|
( |
|
( |
|
( |
||||
Loss before income taxes |
|
( |
|
( |
|
( |
||||
Income tax (expense) benefit |
|
( |
|
|
|
( |
||||
Net loss |
|
( |
|
( |
|
( |
||||
Loss attributable to noncontrolling interest |
|
|
|
|
|
|
||||
Net loss attributable to Clean Energy Fuels Corp. |
$ |
( |
$ |
( |
$ |
( |
||||
Net loss attributable to Clean Energy Fuels Corp. per share: |
|
|
|
|
|
|||||
Basic and diluted |
$ |
( |
$ |
( |
$ |
( |
||||
Weighted-average common shares outstanding: |
|
|
|
|
|
|||||
Basic and diluted |
|
|
|
|
|
|
||||
See accompanying notes to consolidated financial statements.
58
CLEAN ENERGY FUELS CORP. AND SUBSIDIARIES
CONSOLIDATED STATEMENTS OF COMPREHENSIVE LOSS
(In thousands)
Year Ended December 31, 2022 |
Year Ended December 31, 2023 |
Year Ended December 31, 2024 |
|||||||||||||||||||||||||
|
Clean Energy |
|
Noncontrolling |
|
|
Clean Energy |
|
Noncontrolling |
|
|
Clean Energy |
|
Noncontrolling |
|
|||||||||||||
|
Fuels Corp. |
|
Interest |
Total |
|
Fuels Corp. |
|
Interest |
Total |
|
Fuels Corp. |
|
Interest |
Total |
|||||||||||||
Net loss |
$ |
( |
$ |
( |
$ |
( |
$ |
( |
$ |
( |
$ |
( |
$ |
( |
$ |
( |
$ |
( |
|||||||||
Other comprehensive income (loss), net of tax: |
|
|
|
|
|
|
|
|
|
|
|
|
|
|
|
|
|
|
|||||||||
Foreign currency translation adjustments net of $ |
|
( |
|
|
( |
|
|
|
|
|
|
( |
|
( |
|||||||||||||
Unrealized gain (loss) on available-for-sale securities, net of $ |
|
( |
|
|
( |
|
|
|
|
|
|
|
|
|
|||||||||||||
Total other comprehensive income (loss), net of tax |
|
( |
|
|
|
( |
|
|
|
|
|
|
|
( |
|
|
|
( |
|||||||||
Comprehensive loss |
$ |
( |
$ |
( |
$ |
( |
$ |
( |
$ |
( |
$ |
( |
$ |
( |
$ |
( |
$ |
( |
|||||||||
See accompanying notes to consolidated financial statements.
59
CLEAN ENERGY FUELS CORP. AND SUBSIDIARIES
CONSOLIDATED STATEMENTS OF STOCKHOLDERS’ EQUITY
(In thousands, except share data)
Accumulated |
||||||||||||||||||||
Common stock |
Additional |
Other |
Noncontrolling |
Total |
||||||||||||||||
|
|
|
Paid-In |
|
Accumulated |
|
Comprehensive |
|
Interest in |
|
Stockholders’ |
|||||||||
|
Shares |
|
Amount |
Capital |
Deficit |
Income (Loss) |
Subsidiary |
Equity |
||||||||||||
Balance, December 31, 2021 |
|
|
$ |
|
$ |
|
$ |
( |
$ |
( |
$ |
|
$ |
|
||||||
Issuance of common stock, net of issuance costs |
|
|
|
|
— |
— |
— |
|
|
|||||||||||
Repurchase of common stock |
( |
( |
( |
— |
— |
— |
( |
|||||||||||||
Stock-based compensation |
|
— |
— |
|
— |
— |
— |
|
|
|||||||||||
Stock-based sales incentive charges |
— |
— |
|
— |
— |
— |
|
|||||||||||||
Net loss |
|
— |
— |
— |
( |
— |
( |
|
( |
|||||||||||
Other comprehensive loss |
|
— |
— |
— |
— |
( |
— |
|
( |
|||||||||||
Balance, December 31, 2022 |
|
|
|
|
|
|
|
( |
|
( |
|
|
|
|
||||||
Issuance of common stock |
|
|
|
|
— |
— |
— |
|
|
|||||||||||
Shares withheld related to net share settlement |
— |
— |
( |
— |
— |
— |
( |
|||||||||||||
Stock-based compensation |
|
— |
— |
|
— |
— |
— |
|
|
|||||||||||
Stock-based sales incentive charges |
— |
— |
|
— |
— |
— |
|
|||||||||||||
Issuance of common stock warrants |
— |
— |
|
— |
— |
— |
|
|||||||||||||
Net loss |
|
— |
— |
— |
( |
— |
( |
|
( |
|||||||||||
Other comprehensive loss |
|
— |
— |
— |
— |
|
— |
|
|
|||||||||||
Balance, December 31, 2023 |
|
|
|
|
( |
( |
|
|
||||||||||||
Issuance of common stock |
|
|
|
— |
— |
— |
|
|||||||||||||
Shares withheld related to net share settlement |
— |
— |
( |
— |
— |
— |
( |
|||||||||||||
Stock-based compensation |
— |
— |
|
— |
— |
— |
|
|||||||||||||
Stock-based sales incentive charges |
— |
— |
|
— |
— |
— |
|
|||||||||||||
Issuance of common stock warrants |
— |
— |
|
— |
— |
— |
|
|||||||||||||
Net loss |
— |
— |
— |
( |
— |
( |
( |
|||||||||||||
Other comprehensive income |
— |
— |
— |
— |
( |
— |
( |
|||||||||||||
Balance, December 31, 2024 |
|
$ |
|
$ |
|
$ |
( |
$ |
( |
$ |
|
$ |
|
|||||||
See accompanying notes to consolidated financial statements.
60
CLEAN ENERGY FUELS CORP. AND SUBSIDIARIES
CONSOLIDATED STATEMENTS OF CASH FLOWS
(In thousands)
Year Ended December 31, |
|||||||||
|
2022 |
|
2023 |
|
2024 |
||||
Cash flows from operating activities: |
|||||||||
Net loss |
$ |
( |
$ |
( |
$ |
( |
|||
Adjustments to reconcile net loss to net cash provided by (used in) operating activities: |
|
|
|
||||||
Depreciation and amortization |
|
|
|
|
|
|
|||
Provision for credit losses and inventory |
|
|
|
|
|
|
|||
Stock-based compensation expense |
|
|
|
|
|
|
|||
Stock-based sales incentive charges |
|
|
|
||||||
Change in fair value of derivative instruments |
|
( |
|
|
|
|
|||
Amortization of debt issuance costs |
|
|
|
||||||
Amortization of discounts and Section 30C tax credit |
|
( |
|
( |
|
( |
|||
Loss (gain) on disposal of property and equipment |
|
|
|
|
|
|
|||
Loss on extinguishment of debt |
|
|
|
|
|
|
|||
Asset impairments and other charges |
|
|
|
|
|
|
|||
Impairment of investments in equity securities |
|
|
|
|
|
|
|||
Loss from equity method investments |
|
|
|
|
|
|
|||
Non-cash lease expense |
|
|
|
||||||
Deferred income taxes |
|
( |
|
||||||
Changes in operating assets and liabilities: |
|
|
|
||||||
Accounts and other receivables |
|
( |
|
( |
|
( |
|||
Inventory |
|
( |
|
( |
|
( |
|||
Prepaid expenses and other assets |
|
( |
|
|
|
|
|||
Operating lease liabilities |
( |
( |
( |
||||||
Accounts payable |
|
|
|
|
|
( |
|||
Deferred revenue |
|
( |
|
( |
|
|
|||
Accrued liabilities and other |
|
|
|
( |
|
|
|||
Net cash provided by operating activities |
|
|
|
|
|
|
|||
Cash flows from investing activities: |
|
|
|
|
|
||||
Purchases of short-term investments |
|
( |
|
( |
|
( |
|||
Maturities and sales of short-term investments |
|
|
|
|
|
|
|||
Payment and deposits on equipment and manure rights for ADG RNG production projects |
|
( |
|
( |
|
( |
|||
Purchases of and deposits on property and equipment |
|
( |
|
( |
|
( |
|||
Grant proceeds for capital projects |
|
|
|
||||||
Proceeds received for joint development and construction of station projects |
|
|
|
|
|
|
|||
Disbursements for loans receivable |
|
( |
|
( |
|
( |
|||
Proceeds from paydowns, maturities, and sales of loans receivable |
|
|
|
|
|
|
|||
Cash received from sale of certain assets of subsidiary, net |
|
|
|
|
|
|
|||
Investments in other entities |
|
( |
|
( |
|
( |
|||
Advance to DR JV |
|
|
( |
|
|
||||
Proceeds from repayment of advance by DR JV |
|
|
|
|
|
||||
Proceeds from settlement of insurance claims |
|
|
|
|
|
||||
Proceeds from disposal of property and equipment |
|
|
|
|
|
|
|||
Net cash (used in) investing activities |
|
( |
|
( |
|
( |
|||
Cash flows from financing activities: |
|
|
|
|
|
||||
Issuance of common stock |
|
|
|
|
|
|
|||
Payment of tax withholdings on net settlement of equity awards |
|
( |
( |
||||||
Fees paid for lender and debt issuance costs |
( |
( |
( |
||||||
Proceeds for Adopt-A-Port program |
|
|
|
||||||
Repayment of proceeds for Adopt-A-Port program |
( |
( |
( |
||||||
Proceeds from debt instruments |
|
|
|
|
|
|
|||
Proceeds from revolving line of credit |
|
|
|
||||||
Repayments of borrowing under revolving line of credit |
|
( |
|
|
|
|
|||
Repayments of debt instruments and finance lease obligations |
|
( |
|
( |
|
( |
|||
Payments of debt extinguishment costs |
( |
( |
|
||||||
Net cash provided by (used in) financing activities |
|
|
|
|
|
( |
|||
Effect of exchange rates on cash, cash equivalents and restricted cash |
|
( |
|
|
|
( |
|||
Net increase (decrease) in cash, cash equivalents and restricted cash |
|
|
|
( |
|
( |
|||
Cash, cash equivalents and restricted cash, beginning of period |
|
|
|
|
|
|
|||
Cash, cash equivalents and restricted cash, end of period |
$ |
|
$ |
|
$ |
|
|||
Supplemental disclosure of cash flow information: |
|
|
|
|
|
|
|||
Income taxes paid |
$ |
|
$ |
|
$ |
|
|||
Interest paid, net of $ |
$ |
|
$ |
|
$ |
|
|||
See accompanying notes to consolidated financial statements.
61
CLEAN ENERGY FUELS CORP. AND SUBSIDIARIES
NOTES TO CONSOLIDATED FINANCIAL STATEMENTS
Note 1 —Summary of Significant Accounting Policies
The Company and Nature of Business
Clean Energy Fuels Corp., together with its majority and wholly owned subsidiaries (hereinafter collectively referred to as the “Company,” unless the context or the use of the term indicates or requires otherwise) is engaged in the business of selling renewable and conventional natural gas as alternative fuels for vehicle fleets and related fueling solutions to its customers, primarily in the United States (“U.S.”) and Canada. The Company’s principal business is supplying renewable natural gas (“RNG”) and conventional natural gas, in the form of compressed natural gas (“CNG”) and liquefied natural gas (“LNG”), for medium and heavy-duty vehicles and providing operation and maintenance (“O&M”) services to public and private vehicle fleet customer stations. The Company is also focused on developing, owning, and operating dairy and other livestock waste RNG projects and supplying RNG (procured from third party sources and from the DR JV (as defined below), one of the Company’s jointly owned RNG production facilities (see Note 3)) to its customers in the heavy and medium-duty commercial transportation sector.
As a comprehensive clean energy solutions provider, the Company also designs and builds, as well as operates and maintains, public and private vehicle fueling stations in the United States and Canada; sells and services compressors and other equipment used in RNG production and at fueling stations; transports and sells RNG and conventional natural gas, in the form of CNG and LNG, via “virtual” natural gas pipelines and interconnects; sells U.S. federal, state and local government credits it generates by selling RNG in the form of CNG and LNG as a vehicle fuel, including Renewable Identification Numbers (“RIN Credits” or “RINs”) under the federal Renewable Fuel Standard Phase 2 and credits under the California, Oregon, and Washington Low Carbon Fuel Standards (collectively, “LCFS Credits”); and obtains federal, state and local tax credits, grants and incentives.
Basis of Presentation
The accompanying consolidated financial statements include the accounts of the Company and its subsidiaries, and, in the opinion of management, reflect all adjustments, which include only normal recurring adjustments, necessary to state fairly the Company’s consolidated financial position, results of operations, comprehensive income (loss), stockholders’ equity, and cash flows in accordance with accounting principles generally accepted in the United States of America (“U.S. GAAP”). All intercompany accounts and transactions have been eliminated in consolidation.
Use of Estimates
The preparation of consolidated financial statements in conformity with U.S. GAAP requires management to make estimates and assumptions that affect the amounts reported in the accompanying consolidated financial statements and these notes. Actual results could differ from those estimates and may result in material effects on the Company’s operating results and financial position. Significant estimates made in preparing the accompanying consolidated financial statements include (but are not limited to) those related to revenue recognition, fair value measurements, goodwill and long-lived asset valuations and impairment assessments, income tax valuations, stock-based compensation expense and stock-based sales incentive charges.
Inventory
Inventory consists of raw materials and spare parts, work in process and finished goods and is stated at the lower of cost (first-in, first-out) or net realizable value. The Company evaluates inventory balances for excess quantities and obsolescence by analyzing estimated demand, inventory on hand, sales levels and other information and reduces inventory balances to net realizable value for excess and obsolete inventory based on this analysis.
62
CLEAN ENERGY FUELS CORP. AND SUBSIDIARIES
NOTES TO CONSOLIDATED FINANCIAL STATEMENTS (Continued)
Inventories consisted of the following as of December 31, 2023 and 2024 (in thousands):
|
December 31, |
|
December 31, |
|||
2023 |
2024 |
|||||
Raw materials and spare parts |
$ |
|
$ |
|
||
Total inventory |
$ |
|
$ |
|
||
Derivative Instruments and Hedging Activities
In connection with the Company’s Zero Now truck financing program, the Company entered into commodity swap contracts in October 2018 intended to manage risks related to the diesel-to-natural gas price spread in connection with the natural gas fuel supply commitments the Company makes in its fueling agreements with fleet operators that participate in the Zero Now program. The Company has not designated any derivative instruments as hedges for accounting purposes and does not enter into such instruments for speculative trading purposes. These derivative instruments are recorded in the accompanying consolidated balance sheets and are measured as either an asset or liability at fair value with changes in fair value recognized in earnings. See Note 6 for more information.
Property and Equipment
Property and equipment are recorded at cost. Depreciation and amortization are recognized over the estimated useful lives of the assets using the straight-line method. The estimated useful lives of depreciable assets are to
Grant proceeds received for the years ended December 31, 2023 and 2024 were approximately $
Leases
On January 1, 2019, the Company adopted Accounting Standards Codification (“ASC”) 842, Leases, whereby leases are classified as either operating leases or finance leases.
At the inception of a contract the Company assesses whether the contract is, or contains, a lease. The Company’s assessment is based on: (1) whether the contract involves the use of a distinct identified asset, (2) whether the Company obtains the right to substantially all the economic benefit from the use of the asset throughout the period, and (3) whether the Company has the right to direct the use of the asset. The commencement date of the contract is the date the lessor makes the underlying asset available for use by the lessee.
63
CLEAN ENERGY FUELS CORP. AND SUBSIDIARIES
NOTES TO CONSOLIDATED FINANCIAL STATEMENTS (Continued)
Right-of-use (“ROU”) assets represent the Company’s right to use an underlying asset during the lease term and lease liabilities represent obligations to make lease payments arising from the lease. ROU assets and lease liabilities are recognized at the commencement date based on the net present value of fixed lease payments over the lease term. ROU assets also include any initial direct costs and advance lease payments made and exclude lease incentives. Lease liabilities also include terminal purchase options when deemed reasonably certain to exercise. The Company’s lease term includes options to extend when it is reasonably certain that it will exercise that option. The Company has elected not to recognize ROU assets and lease liabilities for short-term leases that have a term of 12 months or less; the Company recognizes lease expense for these leases on a straight-line basis over the lease term.
As most of the Company’s operating leases do not have an implicit rate that can be readily determined, the Company uses its secured incremental borrowing rate for the same term as the underlying lease based on information available at lease commencement. For finance leases, the Company uses the rate implicit in the lease.
The lease classification affects the expense recognition on the consolidated statements of operations. Operating lease charges are recorded in “Cost of sales, exclusive of depreciation and amortization,” and “Selling, general and administrative” expense. Finance lease charges are split, whereby depreciation on assets under finance leases is recorded in “Depreciation and amortization” expense and an implied interest component is recorded in “Interest expense.” The expense recognition for operating leases and finance leases is substantially consistent with legacy accounting.
Long-Lived Assets
The Company reviews the carrying value of its long-lived assets, including property and equipment and intangible assets with finite useful lives, for impairment whenever events or changes in circumstances indicate that the carrying value of an asset or asset group may not be recoverable. Events that could result in an impairment review include, among others, a significant decrease in the operating performance of a long-lived asset or asset group or the decision to close a fueling station. Impairment testing involves a comparison of the sum of the undiscounted future cash flows of the asset or asset group to its carrying amount. If the sum of the undiscounted future cash flows exceeds the carrying amount, then no impairment exists. If the carrying amount exceeds the sum of the undiscounted future cash flows, then a second step is performed to determine the amount of impairment, if any, to be recognized. An impairment loss is recognized to the extent that the carrying amount of the asset or asset group exceeds its fair value. The fair value of the asset or asset group is based on estimated discounted future cash flows of the asset or asset group using a discount rate commensurate with the related risk. The estimate of future cash flows requires management to make assumptions and to apply judgment, including forecasting future sales and expenses and estimating useful lives of the assets. These estimates can be affected by a number of factors, including, among others, future results, demand, and economic conditions, many of which can be difficult to predict.
There were
Intangible assets with finite useful lives are amortized over their respective estimated useful lives using the straight-line method. The estimated useful lives of intangible assets with finite useful lives are to
64
CLEAN ENERGY FUELS CORP. AND SUBSIDIARIES
NOTES TO CONSOLIDATED FINANCIAL STATEMENTS (Continued)
The Company’s intangible assets as of December 31, 2023 and 2024 were as follows (in thousands):
|
2023 |
|
2024 |
|||
Customer relationships |
$ |
|
$ |
|
||
Acquired contracts |
|
|
|
|
||
Trademark and trade names |
|
|
|
|
||
Non-compete agreements |
|
|
|
|
||
Total intangible assets |
|
|
|
|
||
Less accumulated amortization |
|
( |
|
( |
||
Net intangible assets |
$ |
|
$ |
|
||
In connection with the Company’s investment in anaerobic digester gas (“ADG”) RNG production projects, the Company acquired contractual rights relating to manure feedstock totaling $
Estimated amortization expense subsequent to the year ended December 31, 2024 is expected to be approximately $
Goodwill
Goodwill represents the excess of costs incurred over the fair value of the net assets of acquired businesses. The Company assesses its goodwill using either a qualitative or quantitative approach to determine whether it is more likely than not that the fair value of its reporting unit is less than its carrying value. The Company is required to use judgment when applying the goodwill impairment test, including, among other considerations, the identification of reporting unit(s), the assessment of qualitative factors, and the estimation of fair value of a reporting unit in the quantitative approach. The Company determined that it is a single reporting unit for the purpose of goodwill impairment tests. The Company performs the impairment test annually on October 1, or more frequently if facts and circumstances warrant a review.
The qualitative goodwill assessment includes the potential effect on a reporting unit’s fair value of certain events and circumstances, including its enterprise value, macroeconomic conditions, industry and market considerations, cost factors, and other relevant entity-specific events. If it is determined, based upon the qualitative assessment, that it is more likely than not that the reporting unit’s fair value is less than its carrying amount, then a quantitative impairment test is performed. Alternatively, the Company may bypass the qualitative assessment for a reporting unit and directly perform the quantitative goodwill impairment test.
The quantitative goodwill impairment test estimates the reporting unit's fair value based on its market value of invested capital plus a market participant acquisition premium derived from recent merger and acquisition transactions in comparable industry and market sectors as those in which the Company operates. The estimates, including the estimation methodology, used to determine the fair value of the reporting unit may change based on results of operations, macroeconomic conditions, stock price fluctuations or other factors. Changes in these estimates could materially affect the assessment of the fair value and goodwill impairment for the reporting unit.
65
CLEAN ENERGY FUELS CORP. AND SUBSIDIARIES
NOTES TO CONSOLIDATED FINANCIAL STATEMENTS (Continued)
In 2024, the Company bypassed the qualitative assessment and directly performed the quantitative goodwill impairment test on October 1, 2024, for the single reporting unit, as described above, due to a decline in the market price of the Company’s common stock, which resulted in a fair value, based on its market value of invested capital plus a market participant acquisition premium, that exceeded carrying value by
Due to another decline in the market price of the Company’s common stock subsequent to October 1, 2024, an interim quantitative goodwill impairment test was performed as of December 31, 2024 for the single reporting unit as described above, which resulted in a fair value, based on its market value of invested capital plus a market participant acquisition premium, that exceeded carrying value by
Subsequent to December 31, 2024, there have been increases in the market price of the Company’s common stock and in the Company’s market capitalization. As such, the Company determined that declines experienced in 2024 are not sustained. The Company has not identified other events or circumstances that would more likely than not reduce the fair value of the reporting unit to below its carrying value on a sustained basis. As such, the reporting unit’s goodwill as of December 31, 2024 was not impaired. It is possible that goodwill could become impaired if it is determined in a subsequent period that the fair value of the reporting unit was less than its carrying amount on a sustained basis, which could result in a material charge and adversely affect results of operations.
The Company had also performed interim quantitative goodwill impairment tests as of March 31, 2024, June 30, 2024, and September 30, 2024 for its single reporting unit. Each of the tests performed indicated that the fair value of the Company’s reporting unit exceeded its carrying value.
The following table summarizes the activity related to the carrying amount of goodwill (in thousands):
Balance as of December 31, 2022 |
$ |
|
|
Balance as of December 31, 2023 |
$ |
|
|
Balance as of December 31, 2024 |
$ |
|
Revenue Recognition
The Company recognizes revenue when control of the promised goods or services is transferred to its customers, in an amount that reflects the consideration to which it expects to be entitled in exchange for the goods or services. To achieve that core principle, a five-step approach is applied: (1) identify the contract with a customer, (2) identify the performance obligations in the contract, (3) determine the transaction price, (4) allocate the transaction price to the performance obligations in the contract, and (5) recognize revenue allocated to each performance obligation when the Company satisfies the performance obligation. A performance obligation is a promise in a contract to transfer a distinct good or service to the customer and is the unit of account for revenue recognition.
The Company is generally the principal in its customer contracts because it has control over the goods and services prior to them being transferred to the customer, and as such, revenue is recognized on a gross basis. Sales and usage-based taxes are excluded from revenues. Revenue is recognized net of allowances for returns and any taxes collected from customers, which are subsequently remitted to governmental authorities.
Product Revenue
Volume-Related
The Company’s volume-related product revenue consists of sales of RNG and conventional natural gas, in the form of CNG and LNG, AFTC (defined below) incentives, and sales of RINs and LCFS Credits in addition to Amazon Warrant Charges (defined in Note 12) and changes in fair value of the Company’s derivative instruments associated with providing fuel to customers under contracts.
66
CLEAN ENERGY FUELS CORP. AND SUBSIDIARIES
NOTES TO CONSOLIDATED FINANCIAL STATEMENTS (Continued)
RNG and conventional natural gas are sold pursuant to contractual commitments over defined delivery periods. These contracts typically include a stand-ready obligation to supply natural gas. The Company applies the ‘right to invoice’ practical expedient and recognizes fuel revenue in the amount to which the Company has the right to invoice. The Company has a right to consideration based on the amount of gasoline gallon equivalents (“GGEs”) of fuel dispensed by the customer and current pricing conditions. The Company calculates one GGE to equal 125,000 British Thermal Units (“BTUs”), and, as such, one million BTUs (“MMBTU”) equal eight GGEs. Customers are typically billed on a monthly basis. Since payment terms are less than a year, the Company has elected the practical expedient which allows it to not assess whether a customer contract has a significant financing component.
Contract modifications are not distinct from the existing contract and are typically renewals of fuel sales. As a result, these modifications are accounted for as if they were part of the existing contract. The effect of a contract modification on the transaction price is recognized prospectively.
The Company sells RINs and LCFS Credits to third parties that need the credits to comply with federal and state requirements. Revenue is recognized on these credits when there is an agreement in place to monetize the credits at a determinable price and the RNG fuel has been sold. The sales price for some environmental credit transactions may not be determinable in the period in which the RNG was sold as pricing is established in the quarter after the RNG was sold. In these circumstances, revenue from RIN and LCFS credits is recognized once the sales price has been established and therefore is considered determinable.
Amazon Warrant Charges are determined based on the grant date fair value of the award, and the associated non-cash stock-based sales incentive charges, which are recorded as a reduction of revenue, are recognized as the customer purchases fuel and vesting conditions become probable of being achieved. See discussion under “Amazon Warrant” below and Note 12 for additional information.
The changes in fair value of derivative instruments relate to the Company’s commodity swap and customer fueling contracts under the Zero Now truck financing program. The contracts are measured at fair value with changes in fair value recorded in the accompanying consolidated statements of operations in the period incurred. The amounts are classified as revenue because the Company’s commodity swap contracts are used to economically offset the risk associated with the diesel-to-natural gas price spread resulting from existing and anticipated customer fueling contracts under the Company’s Zero Now truck financing program. See Note 6 for more information about these derivative instruments. For the years ended December 31, 2022, 2023 and 2024, changes in the fair value of commodity swaps and customer contracts amounted to a gain (loss) of $
AFTC is generated when RNG or conventional natural gas is sold for use as fuel to operate a motor vehicle. See discussion under “Alternative Fuel Excise Tax Credit” below for more information about AFTC, which is not recognized as revenue until the period the credit is authorized through federal legislation.
Station Construction Sales
Station construction contracts are generally short-term, except for certain larger and more complex stations, which can take up to 24 months to complete. For most of the Company’s station construction contracts, the customer contracts with the Company to provide a significant service of integrating a complex set of tasks and components into a single station. Hence, the entire contract is accounted for as one performance obligation.
The Company recognizes revenue over time as the Company performs under its station construction contracts because of the continual transfer of control of the goods to the customer, who typically controls the work in process. Revenue is recognized based on the extent of progress towards completion of the performance obligation and is recorded proportionally as costs are incurred. Costs to fulfill the Company’s obligations under these contracts typically include labor, materials and subcontractors’ costs, other direct costs and an allocation of indirect costs.
67
CLEAN ENERGY FUELS CORP. AND SUBSIDIARIES
NOTES TO CONSOLIDATED FINANCIAL STATEMENTS (Continued)
Refinements of estimates to account for changing conditions and new developments are continuous and characteristic of the process. Many factors that can affect contract profitability may change during the performance period of the contract, including differing site conditions, the availability of skilled contract labor, the performance of major suppliers and subcontractors, and unexpected changes in material costs. Because a significant change in one or more of these estimates could affect the profitability of these contracts, the contract price and cost estimates are reviewed periodically as work progresses and adjustments proportionate to the cost-to-cost measure of progress are reflected in contract revenues in the reporting period when such estimates are revised. Provisions for estimated losses on uncompleted contracts are recorded in the period in which the losses become known.
Contract modifications are typically expansions in scope of an existing station construction project. As a result, these modifications are accounted for as if they were part of the existing contract. The effect of a contract modification on the transaction price and the Company’s measure of progress for the performance obligation to which it relates is recognized as an adjustment to revenue (either as an increase or a reduction) on a cumulative catch-up basis.
Under the typical payment terms of the Company’s station construction contracts, the customer makes either performance-based payments (“PBPs”) or progress payments. PBPs are interim payments of the contract price based on quantifiable measures of performance or the achievement of specified events or milestones. Progress payments are interim payments of costs incurred as the work progresses. For some of these contracts, the Company may be entitled to receive an advance payment. The advance payment typically is not considered a significant financing component because it is used to meet working capital demands that can be higher in the early stages of a construction contract and to protect the Company if the customer fails to adequately complete some or all of its obligations under the contract. In addition, the customer retains a small portion of the contract price until completion of the contract. Such retained portion of the contract price is not considered a significant financing component because the intent is to protect the customer.
In certain contracts with its customers, the Company agrees to provide multiple goods or services, including construction of and sale of a station, O&M services, and sale of fuel to the customer. These contracts have multiple performance obligations because the promise to transfer each separate good or service is separately identifiable and distinct. This evaluation requires significant judgment and the decision to combine a group of contracts or separate the combined or single contract into multiple performance obligations could change the amount of revenue recognized in one or more periods.
The Company allocates the contract price to each performance obligation using best estimates of the standalone selling price of each distinct good or service in the contract. The primary method used to estimate the standalone selling price for fuel and O&M services is observable standalone sales, and the primary method used to estimate the standalone selling price for station construction sales is the expected cost plus a margin approach because the Company sells customized customer-specific solutions. Under this approach, the Company forecasts expected costs of satisfying a performance obligation and then adds an appropriate margin for the good or service.
Service Revenue
O&M Services
O&M and other services are sold pursuant to contractual commitments over defined performance periods. These contracts typically include a stand-ready obligation to provide O&M and/or other services based on a committed and agreed upon routine maintenance schedule or when and if called upon by the customer.
68
CLEAN ENERGY FUELS CORP. AND SUBSIDIARIES
NOTES TO CONSOLIDATED FINANCIAL STATEMENTS (Continued)
The Company applies the ‘right to invoice’ practical expedient and recognizes O&M and other services revenue in the amount to which the Company has the right to invoice. The Company has a right to consideration based on services rendered or on amount of GGEs of fuel dispensed by the customer multiplied by an agreed-upon rate. Customers are typically billed on a monthly basis. Since payment terms are less than a year, the Company has elected the practical expedient which allows it to not assess whether a customer contract has a significant financing component.
Contract modifications are not distinct from the existing contract and are typically renewals of O&M and other service sales. As a result, these modifications are accounted for as if they were part of the existing contract. The effect of a contract modification on the transaction price is recognized prospectively.
Other services
The majority of other services revenue consist of sales of used natural gas heavy-duty trucks purchased by the Company and management fees relating to management services provided to the Company’s equity method investees and joint ventures with TotalEnergies and bp. Revenue on sales contracts of used natural gas trucks is recognized at the point in time when the customer accepts delivery of the truck. Management fee revenue is recognized over time on a monthly basis as services are rendered by the Company.
Alternative Fuel Excise Tax Credit
Under separate pieces of U.S. federal legislation, the Company was eligible to receive a federal alternative fuel excise tax credit (“AFTC”) for its natural gas vehicle fuel sales made between October 1, 2006 and December 31, 2021. The AFTC credit was equal to $
Based on the service relationship with its customers, either the Company or its customer claims the credit. The Company records its AFTC credits, if any, as revenue in its consolidated statements of operations because the credits are fully payable to the Company and do not offset income tax liabilities. As such, the credits are not deemed income tax credits under the accounting guidance applicable to income taxes.
LNG Transportation Costs
The Company records the costs incurred to transport LNG to its customers in “Product cost of sales” in the accompanying consolidated statements of operations.
Advertising Costs
Advertising costs are expensed as incurred. Advertising costs were immaterial for the years ended December 31, 2022, 2023 and 2024.
Stock-Based Compensation
The Company recognizes compensation expense for all stock‑based payment arrangements over the requisite service period of the award and recognizes forfeitures as they occur. For service and performance-based stock options, the Company determines the grant date fair value using the Black‑Scholes option pricing model, which requires the input of certain assumptions, including the expected life of the stock‑based payment award, stock price volatility and risk‑free interest rate. For market-based stock options, the Company determines the grant date fair value using the Monte Carlo simulation model, which requires the input of certain assumptions, including the derived service period and the volatility
69
CLEAN ENERGY FUELS CORP. AND SUBSIDIARIES
NOTES TO CONSOLIDATED FINANCIAL STATEMENTS (Continued)
of the Company’s stock price. For restricted stock units, the Company determines the grant date fair value based on the closing market price of its common stock on the date of grant.
Amazon Warrant
The Amazon Warrant (as defined in Note 12) is accounted for as an equity instrument and measured in accordance with ASC 718, Compensation – Stock Compensation. To determine the fair value of the Amazon Warrant, the Company used the Black-Scholes option pricing model, which is based in part on assumptions that require management to use judgment. For awards granted to a customer, which are not in exchange for distinct goods or services, the fair value of the awards earned based on service or performance conditions is recorded as a reduction of the transaction price in accordance with ASC 606, Revenue from Contracts with Customers. Based on the fair value of the award, the Company determines the amount of non-cash stock-based sales incentive charges on the customer’s pro-rata achievement of vesting conditions, which is recorded as a reduction of revenue in the consolidated statements of operations.
Stonepeak Warrant
The Stonepeak Warrant (as defined in Note 12), issued in conjunction with the funding of the Senior Term Loan, is deemed as a separate unit of account from the Loan Facility based on evaluation of the contractual terms of the Stonepeak Credit Agreement and the Warrant Agreement. As a result, amounts are allocated to the Stonepeak Warrant using the relative fair value method and are accounted for as paid-in capital. The Stonepeak Warrant is classified as an equity instrument because the underlying warrants (1) do not embody an obligation of the Company, (2) are deemed to be indexed to the Company’s own common stock, and (3) meet all the conditions for equity classification. As a result, the Stonepeak Warrant is measured at fair value as of the issuance date, and subsequent changes in fair value will not be recognized in earnings. The fair values of the Stonepeak Warrant as of the issuance date were determined using the Black-Scholes option pricing model. In addition, upon the recognition of the Stonepeak Warrant, the Company recognized a warrant asset and additional debt discount to the gross principal of the Senior Term Loan. The additional debt discount relating to the Stonepeak Warrant will be amortized using the interest method in accordance with ASC 835-30, Imputation of Interest, over the contractual term of the Loan Facility and will be recognized in earnings as interest expense in the consolidated statements of operations. The warrant asset will be proportionately reclassified to debt discount when amounts are drawn from the delayed draw term loan commitment, reducing the initial net carrying amount of the funded debt.
Tourmaline Joint Development
In April 2023, the Company and Tourmaline Oil Corp. (“Tourmaline”) announced a CAD $
70
CLEAN ENERGY FUELS CORP. AND SUBSIDIARIES
NOTES TO CONSOLIDATED FINANCIAL STATEMENTS (Continued)
In accordance with ASC 606, the Company determined that it is the principal for the revenue generated from third parties under this collaborative arrangement with Tourmaline; as such, the associated revenue and cost of sales generated and incurred are recognized on a gross basis in the consolidated statements of operations. Net participation of profit and loss owed to or from Tourmaline is recorded as an increase or decrease to cost of sales, respectively, because the transaction is not deemed to be with a customer within the scope of ASC 606. Capitalized station costs are presented at half of the total development and construction costs in the consolidated balance sheets, corresponding to the Company’s
Income Taxes
Income taxes are computed using the asset and liability method. Under this method, deferred income taxes are recognized by applying enacted statutory tax rates applicable to future years to differences between the tax bases and financial carrying amounts of existing assets and liabilities. The impact on deferred taxes of changes in tax rates and laws, if any, is applied to the years during which temporary differences are expected to be settled and are reflected in the consolidated financial statements in the period of enactment. Valuation allowances are established when management determines it is more likely than not that deferred tax assets will not be realized. When evaluating the need for a valuation analysis, we use estimates involving a high degree of judgment including projected future U.S. GAAP income and the amounts and estimated timing of the reversal of any deferred tax assets and liabilities.
The Company has a recognition threshold and a measurement attribute for the financial statement recognition and measurement of tax positions taken or expected to be taken in a tax return. For those benefits to be recognized, a tax position must be more likely than not sustainable upon examination by taxing authorities based on the technical merits of the position. The amount recognized is measured as the largest amount of benefit that has a greater than 50 percent likelihood of being realized upon ultimate settlement. The Company recognizes potential accrued interest and penalties related to unrecognized tax benefit in income tax expense.
The Company operates within multiple domestic and foreign taxing jurisdictions and is subject to audit in these jurisdictions. These audits can involve complex issues, which may require an extended period of time to resolve. Although the Company believes that adequate consideration has been given to these issues, it is possible that the ultimate resolution of these issues could be significantly different from originally estimated.
Net Loss Per Share
Basic net loss per share is computed by dividing the net loss attributable to Clean Energy Fuels Corp. by the weighted-average number of common shares outstanding and common shares issuable for little or no cash consideration during the period. Diluted net loss per share is computed by dividing the net loss attributable to Clean Energy Fuels Corp. by the weighted-average number of common shares outstanding and common shares issuable for little or no cash consideration during the period and potentially dilutive securities outstanding during the period, and therefore reflects the dilution from common shares that may be issued upon exercise or conversion of these potentially dilutive securities, such as stock options, warrants, convertible notes and restricted stock units. The dilutive effect of stock awards and warrants is computed under the treasury stock method. The dilutive effect of convertible notes and restricted stock units is computed under the if-converted method. Potentially dilutive securities are excluded from the computations of diluted net loss per share if their effect would be antidilutive.
Foreign Currency Translation and Transactions
The Company uses the local currency as the functional currency of its foreign subsidiary and equity method investment. Accordingly, all assets and liabilities outside the U.S. are translated into U.S. dollars at the rate of exchange in effect at the balance sheet date. Revenue and expense items are translated at the weighted-average exchange rates prevailing during the period. Foreign currency translation adjustments are recorded in “Accumulated other comprehensive loss” in stockholders’ equity.
71
CLEAN ENERGY FUELS CORP. AND SUBSIDIARIES
NOTES TO CONSOLIDATED FINANCIAL STATEMENTS (Continued)
Foreign currency transactions occur when there is a transaction denominated in other than the respective entity’s functional currency. The Company records the changes in the exchange rate for these transactions in its consolidated statements of operations. For each of the years ended December 31, 2022, 2023 and 2024, foreign exchange transaction gains and (losses) were immaterial and were included in “Other income, net” in the accompanying consolidated statements of operations.
Comprehensive Loss
Comprehensive loss is defined as the change in equity (net assets) of a business enterprise during the period from transactions and other events and circumstances from non-owner sources. The difference between net loss and comprehensive loss for the years ended December 31, 2022, 2023 and 2024 was comprised of the Company’s foreign currency translation adjustments and unrealized gains and losses on available-for-sale securities.
Concentration of Credit Risk
Credit is extended to all customers based on financial condition, and collateral is generally not required. Concentrations of credit risk with respect to trade receivables are limited because of the large number of customers comprising the Company’s customer base and dispersion across many different industries and geographies. Certain international customers, however, have historically been slower to pay on trade receivables. Accordingly, the Company continually monitors collections and payments from its customers and maintains a provision for estimated credit losses based upon its historical experience and any specific customer collection issues that it has identified. Although credit losses have historically been within the Company’s expectations and the provisions established, the Company cannot guarantee that it will continue to experience the same credit loss rates that it has in the past.
Recently Adopted Accounting Pronouncements
In November 2023, the FASB issued ASU No. 2023-07, Segment Reporting (Topic 280): Improvements to Reportable Segment Disclosures. This ASU improves financial reporting by requiring disclosure of significant segment expenses that are regularly provided to the chief operating decision maker (“CODM”) and included with each reported measure of significant profit or loss on an annual and interim basis. This ASU also requires that a public entity disclose the title and position of the CODM and an explanation of how the CODM uses the reported measures of a segment’s profit or loss in assessing segment performance and deciding how to allocate resources. The amendments do not change how reportable segments are determined. We adopted ASU No. 2023-07 during the year ended December 31, 2024. See Note 19 " Reportable Segments and Geographic Information" in the accompanying notes to the consolidated financial statements for further detail.
Recent Accounting Pronouncements Not Yet Adopted
In December 2023, the FASB issued ASU No. 2023-09, Income Taxes (Topic 740): Improvement to Income Tax Disclosures. This ASU enhances annual income tax disclosures by requiring entities to disclose specific categories and greater disaggregation of information in the rate reconciliation table and income taxes paid disaggregated by jurisdiction. The ASU is effective on a prospective basis for annual periods beginning after December 15, 2024, with early adoption permitted. The Company is evaluating the adoption impact of this ASU on the Company’s consolidated financial statements and related disclosures.
In March 2024, the FASB issued ASU No. 2024-01, Compensation-Stock Compensation (Topic 718): Scope Application of Profits Interest and Similar Awards. This ASU improves U.S. GAAP by adding an illustrative example to demonstrate how an entity should apply the scope guidance in paragraph 718-10-15-3 to determine whether profits interest and similar awards should be accounted for in accordance with Topic 718, Compensation-Stock Compensation. The ASU is effective for annual periods, including interim periods within those years, beginning after December 15, 2024, with early
72
CLEAN ENERGY FUELS CORP. AND SUBSIDIARIES
NOTES TO CONSOLIDATED FINANCIAL STATEMENTS (Continued)
adoption allowed. The Company is evaluating the adoption impact of this ASU on the Company’s consolidated financial statements and related disclosures.
In November 2024, the FASB issued ASU No. 2024-03, Income Statement-Reporting Comprehensive Income-Expense Disaggregation Disclosures (Subtopic 220-40): Disaggregation of Income Statement Expenses. This ASU requires disclosure, in the notes to financial statements, of specific information about certain costs and expenses. The ASU is effective for annual periods beginning after December 15, 2026, and interim periods beginning after December 15, 2027, with early adoption allowed. The Company is evaluating the adoption impact of this ASU on the Company’s consolidated financial statements and related disclosures.
Note 2 —Revenue from Contracts with Customers
Disaggregation of Revenue
The table below presents the Company’s revenue disaggregated by revenue source (in thousands):
Year Ended December 31, |
||||||||||
|
2022 |
|
2023 |
|
2024 |
|||||
Product revenue: |
||||||||||
Volume-related |
||||||||||
Fuel sales(1) (3) |
$ |
|
$ |
|
$ |
|
||||
Change in fair value of derivative instruments(2) |
|
( |
( |
|||||||
RIN Credits |
|
|
|
|||||||
LCFS Credits |
|
|
|
|||||||
AFTC (4) |
|
|
|
|
|
|
||||
Total volume-related product revenue |
|
|
|
|||||||
Station construction sales |
|
|
|
|||||||
Total product revenue |
|
|
|
|
|
|
||||
Service revenue: |
||||||||||
Volume-related, O&M services |
|
|
|
|||||||
Other services |
|
|
|
|||||||
Total service revenue |
|
|
|
|||||||
Total revenue |
$ |
|
$ |
|
$ |
|
||||
| (1) |
Includes non-cash stock-based sales incentive contra-revenue charges associated with the Amazon Warrant for the years ended December 31, 2022, 2023 and 2024 of $ |
| (2) | Represents changes in fair value of derivative instruments related to the Company’s commodity swap and customer fueling contracts associated with the Company’s Zero Now truck financing program. The amounts are classified as revenue because the Company’s commodity swap contracts are used to economically offset the risk associated with the diesel-to-natural gas price spread resulting from customer fueling contracts under the Company’s Zero Now truck financing program. See Note 1 and Note 6 for more information about these derivative instruments. |
| (3) |
Includes net settlement of the Company’s commodity swap derivative instruments. For the year ended December 31, 2022, 2023 and 2024, net settlement payments recognized in fuel revenue were $ |
| (4) | Represents AFTC. See Note 1 for more information. |
Remaining Performance Obligations
Remaining performance obligations represent the transaction price of customer orders for which the work has not been performed. As of December 31, 2024, the aggregate amount of the transaction price allocated to remaining performance obligations was $
73
CLEAN ENERGY FUELS CORP. AND SUBSIDIARIES
NOTES TO CONSOLIDATED FINANCIAL STATEMENTS (Continued)
Company expects to recognize revenue on the remaining performance obligations under these contracts over the next to
For volume-related revenue, the Company has elected to apply an optional exemption, which waives the requirement to disclose the remaining performance obligation for revenue recognized through the ‘right to invoice’ practical expedient.
Costs to Fulfill a Contract
The Company capitalizes costs incurred to fulfill its contracts that (1) relate directly to the contract, (2) are expected to generate resources that will be used to satisfy the Company’s performance obligations under the contract, and (3) are expected to be recovered through revenue generated under the contract. Contract fulfillment costs are recorded to depreciation expense as the Company satisfies its performance obligations over the term of the contract. These costs primarily relate to set-up and other direct installation costs incurred by NG Advantage, LLC (“NG Advantage”) for equipment that must be installed on customers’ land before NG Advantage is able to deliver CNG to the customer because the customer does not have direct access to the natural gas pipelines. These costs are classified in “Land, property, and equipment, net” in the accompanying consolidated balance sheets. As of December 31, 2023 and 2024, these capitalized costs incurred to fulfill contracts were $
Tourmaline Joint Development
In April 2023, the Company and Tourmaline announced a Joint Development Agreement to build and operate a network of CNG stations in Western Canada. Costs associated with station construction and profit and loss arising from station operation are shared
The table below presents the financial information of the Joint Development with Tourmaline included in the consolidated statements of operations (in thousands):
Year Ended December 31, |
||||||
|
2023 |
|
2024 |
|||
Revenue |
$ |
|
$ |
|
||
Gross profit |
|
|
||||
Operating loss |
( |
$ |
( |
|||
Contract Balances
The timing of revenue recognition, billings and cash collections results in billed accounts receivable, unbilled receivables (contract assets), and customer advances and deposits (contract liabilities) in the accompanying consolidated balance sheets. Changes in the contract asset and liability balances during the year ended December 31, 2024, were not materially affected by any factors outside the normal course of business.
74
CLEAN ENERGY FUELS CORP. AND SUBSIDIARIES
NOTES TO CONSOLIDATED FINANCIAL STATEMENTS (Continued)
As of December 31, 2023 and 2024, the Company’s contract balances were as follows (in thousands):
|
December 31, |
|
December 31, |
|||
2023 |
2024 |
|||||
Accounts receivable, net |
$ |
|
$ |
|
||
|
||||||
Contract assets - current |
$ |
|
$ |
|
||
Contract assets - non-current |
|
|
|
|
||
Contract assets - total |
$ |
|
$ |
|
||
|
||||||
Contract liabilities - current |
$ |
|
$ |
|
||
Contract liabilities - non-current |
|
|
|
|
||
Contract liabilities - total |
$ |
|
$ |
|
||
Accounts Receivable, Net
“Accounts receivable, net” in the accompanying consolidated balance sheets include billed and accrued amounts that are currently due from customers. The amounts due are stated at their net estimated realizable value. The Company maintains an allowance to provide for the estimated amount of receivables that will not be collected. The allowance is based on an assessment of customer creditworthiness, historical payment experience, the age of outstanding receivables, and economic conditions that may affect a customer’s ability to pay.
Contract Assets
Contract assets include unbilled amounts typically resulting from the Company’s station construction sale contracts, when the cost-to-cost method of revenue recognition is utilized and revenue recognized exceeds the amount billed to the customer, and right to payment is not just subject to the passage of time. Amounts may not exceed their net realizable value. Contract assets are classified as current or noncurrent based on the timing of billings. The current portion is included in “Other receivables” and in “Prepaid expenses and other current assets” and the noncurrent portion is included in “Notes receivable and other long-term assets, net” in the accompanying consolidated balance sheets.
Contract Liabilities
Contract liabilities consist of billings in excess of revenue recognized from the Company’s station construction sale contracts and payments received from customers in advance of the satisfaction of performance obligations and are classified as current or noncurrent based on when the revenue is expected to be recognized. The current portion and noncurrent portion of contract liabilities are included in “Deferred revenue” and in “Other long-term liabilities,” respectively, in the accompanying consolidated balance sheets. Contract liabilities of $
Revenue recognized during the year ended December 31, 2023 relating to the Company’s contract liability balances as of December 31, 2022 was $
75
CLEAN ENERGY FUELS CORP. AND SUBSIDIARIES
NOTES TO CONSOLIDATED FINANCIAL STATEMENTS (Continued)
Note 3 —Investments in Other Entities and Noncontrolling Interest in a Subsidiary
TotalEnergies Joint Venture
On March 3, 2021, the Company entered into an agreement (the “TotalEnergies JV Agreement”) with TotalEnergies S.E. (“TotalEnergies”) to create
The Company accounts for its interest in the LLC using the equity method of accounting because the Company does not control but has the ability to exercise significant influence over the LLC’s operations. The Company recorded a loss of $
The following table presents the combined summarized financial information of the TotalEnergies joint venture (in thousands):
Year Ended December 31, |
|||||||||
2022 |
2023 |
2024 |
|||||||
Revenue |
$ |
|
$ |
|
$ |
|
|||
Gross profit |
|
|
|
||||||
Operating loss |
( |
( |
( |
||||||
Net loss |
$ |
( |
$ |
( |
$ |
( |
|||
|
As of December 31, |
|||||
2023 |
2024 |
|||||
Current assets |
$ |
|
$ |
|
||
Non-current assets |
|
|
|
|
||
Total assets |
$ |
|
$ |
|
||
Current liabilities |
$ |
|
$ |
|
||
Non-current liabilities |
|
|
|
|
||
Total liabilities |
$ |
|
$ |
|
||
bp Joint Venture
On April 13, 2021, the Company entered into an agreement (the “bp JV Agreement”) with bp that created a
On December 20, 2023, the bpJV issued a capital call in the amount of $
76
CLEAN ENERGY FUELS CORP. AND SUBSIDIARIES
NOTES TO CONSOLIDATED FINANCIAL STATEMENTS (Continued)
As of December 31, 2024, the and bp each own
Year Ended December 31, |
|||||||||
2022 |
2023 |
2024 |
|||||||
Revenue |
$ |
|
$ |
|
$ |
|
|||
Gross profit |
|
|
( |
||||||
Operating loss |
( |
( |
( |
||||||
Net loss |
( |
( |
( |
||||||
Net loss attributable to bpJV |
$ |
( |
$ |
( |
$ |
( |
|||
|
As of December 31, |
||||||||
2023 |
2024 |
||||||||
Current assets |
|
$ |
|
$ |
|
||||
Non-current assets |
|
|
|||||||
Total assets |
$ |
|
$ |
|
|||||
Current liabilities |
$ |
|
$ |
|
|||||
Non-current liabilities |
|
|
|||||||
Total liabilities |
$ |
|
$ |
|
|||||
Equity attributable to shareowners of bpJV |
$ |
|
$ |
|
|||||
Equity attributable to noncontrolling interest |
|
|
|||||||
Total equity |
$ |
|
$ |
|
|||||
Maas Energy Works, LLC Joint Development
On May 8, 2024, the Company entered into a joint development agreement (the “Maas JDA”) with Maas Energy Works, LLC (“Maas”), granting the Company exclusive right to acquire, fund and participate in the development of certain ADG RNG production projects at dairy farms subject to its due diligence. Pursuant to the Maas JDA, the Company will provide financing to fund the development, construction, operation and maintenance of approved ADG RNG production projects, and Maas will manage and oversee the development, construction, operations and maintenance of such approved projects. The Company will record all the associated income/loss in earnings until a certain rate of return is achieved and then receive
Pursuant to the Maas JDA, each approved ADG RNG production project will be formed as a separate, special purpose project limited liability company that will be wholly-owned by a holding company (collectively, the “Project LLC”), which is jointly controlled by Maas and the Company. The Company accounts for its interest in the Project LLC using the equity method of accounting because it has the ability to exercise significant influence but does not control the Project LLC’s operations. In the year ended December 31, 2024, the Project LLC issued capital calls totaling $
77
CLEAN ENERGY FUELS CORP. AND SUBSIDIARIES
NOTES TO CONSOLIDATED FINANCIAL STATEMENTS (Continued)
been contributed by the Company. Proceeds of the capital calls will be used to develop and construct ADG RNG projects.
SAFE S.p.A
In December 2024, in order to effect a change in corporate form, SAFE&CEC S.r.l. was merged into its wholly owned subsidiary SAFE S.p.A., with SAFE S.p.A. as the surviving entity. Our rights and ownership in the combined entity were not impacted. SAFE S.p.A. is focused on manufacturing, selling and servicing natural gas fueling compressors and related equipment for the global natural gas fueling market. As of December 31, 2024, the Company owns a
Year Ended December 31, |
|||||||||
2022 |
2023 |
2024 |
|||||||
Revenue |
$ |
|
$ |
|
$ |
|
|||
Gross profit |
|
|
|
||||||
Operating income (loss) |
|
( |
( |
||||||
Net income (loss) |
$ |
|
$ |
( |
$ |
( |
|||
|
As of December 31, |
||||||||
2023 |
2024 |
||||||||
Current assets |
|
$ |
|
$ |
|
||||
Non-current assets |
|
|
|||||||
Total assets |
$ |
|
$ |
|
|||||
Current liabilities |
$ |
|
$ |
|
|||||
Non-current liabilities |
|
|
|||||||
Total liabilities |
$ |
|
$ |
|
|||||
Other Equity Method Investments
The Company had investment balances in other equity method investments totaling $
|
Year Ended December 31, |
||||||||
2022 |
2023 |
2024 |
|||||||
Revenue |
$ |
|
$ |
|
$ |
|
|||
Gross profit |
|
|
|
||||||
Operating loss |
( |
( |
( |
||||||
Net loss |
$ |
( |
$ |
( |
$ |
( |
|||
78
CLEAN ENERGY FUELS CORP. AND SUBSIDIARIES
NOTES TO CONSOLIDATED FINANCIAL STATEMENTS (Continued)
|
As of December 31, |
|||||
2023 |
2024 |
|||||
Current assets |
$ |
|
$ |
|
||
Non-current assets |
|
|
|
|
||
Total assets |
$ |
|
$ |
|
||
Current liabilities |
$ |
|
$ |
|
||
Non-current liabilities |
|
|
|
|
||
Total liabilities |
$ |
|
$ |
|
||
NG Advantage
On October 14, 2014, the Company entered into a Common Unit Purchase Agreement (“UPA”) with NG Advantage for a
In connection with the arrangement between NG Advantage and bp for the supply, sale and reservation of a specified volume of CNG transportation capacity until February 2022, on February 28, 2018, the Company entered into a guaranty agreement with NG Advantage and bp pursuant to which the Company guaranteed NG Advantage’s payment obligations to bp in the event of default by NG Advantage under the supply arrangement, in an amount up to an aggregate of $
On October 1, 2018, the Company purchased
In each month from November 2018 through February 2019, the Company was issued
During the year ended December 31, 2019, the Company agreed to lend NG Advantage up to $
On February 29, 2020, NG Advantage issued to the Company
79
CLEAN ENERGY FUELS CORP. AND SUBSIDIARIES
NOTES TO CONSOLIDATED FINANCIAL STATEMENTS (Continued)
For the year ended December 31, 2022, NG Advantage borrowed $
The Company recorded a loss attributable to the noncontrolling interest in NG Advantage of $
Investments in Equity Securities
For investments in equity securities of privately held entities without readily determinable fair values, the Company measures such investments at cost, adjusted for impairment, if any, and observable price changes in orderly transactions for the identical or similar investment of the same issuer. The Company reviews the carrying value of its cost method investments for impairment at each reporting period, to identify whenever events or changes in circumstances indicate that the investment amount may not be recoverable. As a result of the investees’ deteriorating financial results in late 2024, including continuing losses and operating cash outflows, the Company concluded that its investments are impaired as of December 31, 2024 and recognized an impairment loss of $
Note 4 —Cash, Cash Equivalents and Restricted Cash
Cash, cash equivalents and restricted cash as of December 31, 2023 and 2024 consisted of the following (in thousands):
|
December 31, |
|
December 31, |
|||
2023 |
2024 |
|||||
Current assets: |
|
|
|
|
||
Cash and cash equivalents |
$ |
|
$ |
|
||
Restricted cash - standby letter of credit |
|
|
|
|
||
Total cash, cash equivalents and current portion of restricted cash |
$ |
|
$ |
|
||
The Company considers all highly liquid investments with maturities of three months or less on the date of acquisition to be cash equivalents, except for U.S. government securities.
The Company places its cash and cash equivalents with high credit quality financial institutions. At times, such investments may be in excess of the Federal Deposit Insurance Corporation (“FDIC”) and Canadian Deposit Insurance Corporation (“CDIC”) limits. Financial instruments that potentially subject the Company to concentrations of credit risk consist principally of cash deposits. The amounts in excess of FDIC and CDIC limits were approximately $
The Company classifies restricted cash as short-term and a current asset if the cash is expected to be used in operations within a year or to acquire a current asset. Otherwise, the restricted cash is classified as long-term. The Company deposited $
80
CLEAN ENERGY FUELS CORP. AND SUBSIDIARIES
NOTES TO CONSOLIDATED FINANCIAL STATEMENTS (Continued)
Note 5 —Short-Term Investments
Short-term investments include available-for-sale debt securities, excluded from cash equivalents, that have maturities of one year or less on the date of acquisition and certificates of deposit. Available-for-sale debt securities are carried at fair value, inclusive of unrealized gains and losses. Unrealized gains and losses on available for sale debt securities are recognized in other comprehensive income (loss), net of applicable income taxes. Gains or losses on sales of available-for-sale debt securities are recognized on the specific identification basis.
The Company reviews available-for-sale debt securities for declines in fair value below their cost basis each quarter and whenever events or changes in circumstances indicate that the cost basis of an asset may not be recoverable, and evaluates the current expected credit loss. This evaluation is based on a number of factors, including historical experience, market data, issuer-specific factors, economic conditions, and any changes to the credit rating of the security. As of December 31, 2024, the Company has not recorded a credit loss related to available-for-sale debt securities and believes the carrying values for its available-for-sale debt securities are properly recorded.
Short-term investments as of December 31, 2023 consisted of the following (in thousands):
Gross |
|||||||||
Amortized |
Unrealized |
Estimated |
|||||||
|
Cost |
|
Gain (Loss) |
|
Fair Value |
||||
U.S. government securities |
$ |
|
$ |
|
$ |
|
|||
Certificates of deposit |
|
|
|
— |
|
|
|||
Total short-term investments |
$ |
|
$ |
|
$ |
|
|||
Short-term investments as of December 31, 2024 consisted of the following (in thousands):
Gross |
|||||||||
Amortized |
Unrealized |
Estimated |
|||||||
|
Cost |
|
Gain (Loss) |
|
Fair Value |
||||
U.S. government securities |
$ |
|
$ |
|
$ |
|
|||
Certificates of deposit |
|
— |
|
||||||
Total short-term investments |
$ |
|
$ |
|
$ |
|
|||
Note 6 —Derivative Instruments and Hedging Activities
In October 2018, the Company executed
The Company has entered into fueling agreements with fleet operators under the Zero Now truck financing program. Certain of these fueling agreements contain a pricing feature indexed to diesel, which the Company determined to be an embedded derivative and is recorded at fair value at the time of execution, with the changes in fair value of the embedded derivative recognized in “Product revenue” in the accompanying consolidated statements of operations.
81
CLEAN ENERGY FUELS CORP. AND SUBSIDIARIES
NOTES TO CONSOLIDATED FINANCIAL STATEMENTS (Continued)
Embedded derivatives as of December 31, 2023 consisted of the following (in thousands):
Gross Amounts |
Gross Amounts |
Net Amount |
|||||||
|
Recognized |
|
Offset |
|
Presented |
||||
Assets: |
|
|
|
|
|
|
|||
Fueling agreements: |
|||||||||
Prepaid expenses and other current assets |
$ |
|
$ |
|
$ |
|
|||
Notes receivable and other long-term assets, net |
|
|
|
||||||
Total derivative assets |
$ |
|
$ |
|
$ |
|
|||
Liabilities: |
|
|
|
|
|
|
|||
Commodity swaps: |
|||||||||
$ |
|
$ |
|
$ |
|
||||
Total derivative liabilities |
$ |
|
$ |
|
$ |
|
|||
Commodity swaps and embedded derivatives as of December 31, 2024 consisted of the following (in thousands):
Gross Amounts |
Gross Amounts |
Net Amount |
|||||||
|
Recognized |
|
Offset |
|
Presented |
||||
Assets: |
|
|
|
|
|
|
|||
Fueling agreements: |
|||||||||
Prepaid expenses and other current assets |
$ |
|
$ |
— |
$ |
|
|||
Notes receivable and other long-term assets, net |
|
— |
|
||||||
Total derivative assets |
$ |
|
$ |
— |
$ |
|
|||
As of December 31, 2023, the Company had a total volume on open commodity swap contracts of
The following table reflects the weighted-average price of open commodity swap contracts as of December 31, 2023 and 2024, by year with associated volumes:
December 31, 2023 |
December 31, 2024 |
|||||||||
Volumes |
Weighted-Average Price per |
Volumes |
Weighted-Average Price per |
|||||||
Year |
|
(Diesel Gallons) |
|
Diesel Gallon |
|
(Diesel Gallons) |
|
Diesel Gallon |
||
2024 |
|
|
$ |
|
|
$ |
|
|||
Note 7 —Fair Value Measurements
The Company follows the authoritative guidance for fair value measurements with respect to assets and liabilities that are measured at fair value on a recurring basis and non-recurring basis. Under the standard, fair value is defined as the exit price, or the amount that would be received to sell an asset or paid to transfer a liability in an orderly transaction between market participants, as of the measurement date. The standard also establishes a hierarchy for inputs used in measuring fair value that maximizes the use of observable inputs and minimizes the use of unobservable inputs by requiring that the most observable inputs be used when available. Observable inputs are inputs market participants would use in valuing the asset or liability developed based on market data obtained from sources independent of the Company. Unobservable inputs are inputs that reflect the Company’s assumptions about the factors market participants would use in valuing the asset or liability developed based upon the best information available in the circumstances. The hierarchy consists of the following three levels: Level 1 inputs are quoted prices (unadjusted) in active markets for identical assets or liabilities; Level 2 inputs include quoted prices for similar assets or liabilities in active markets, quoted prices for identical or similar assets or liabilities in markets that are not active, and inputs (other than quoted prices) that are observable for the asset or liability, either directly or indirectly; Level 3 inputs are unobservable inputs for the asset or liability. Categorization within the valuation hierarchy is based upon the lowest level of input that is significant to the fair value measurement.
82
CLEAN ENERGY FUELS CORP. AND SUBSIDIARIES
NOTES TO CONSOLIDATED FINANCIAL STATEMENTS (Continued)
Assets and Liabilities Measured at Fair Value on a Recurring Basis
The Company’s U.S. government issued debt securities are classified within Level 1 because they are valued using the most recent quoted prices for identical assets in active markets. Certificate of deposits are classified within Level 2 because they are valued using the most recent quoted prices for identical assets in markets that are not active and quoted prices for similar assets in active markets.
The Company used the income approach to value its outstanding commodity swap contracts and embedded derivatives in its fueling agreements under the Zero Now truck financing program (see Note 6). Under the income approach, the Company used a discounted cash flow (“DCF”) model in which cash flows anticipated over the term of the contracts are discounted to their present value using an expected discount rate. The discount rate used for cash flows reflects the specific risks in spot and forward rates and credit valuation adjustments. This valuation approach is considered a Level 3 fair value measurement. The significant unobservable inputs used in the fair value measurement of the Company’s derivative instruments are Ultra-Low Sulfur Diesel (“ULSD”) forward prices and differentials from ULSD to Petroleum Administration for Defense District (“PADD”) regions. Significant increases (decreases) in any of those inputs in isolation would result in a significantly lower or higher fair value measurement. Generally, a change in the ULSD forward prices is accompanied by a directionally opposite but less extreme change in the ULSD-PADD differential.
The Company estimated the fair value of its outstanding commodity swap contracts based on the following inputs as of December 31, 2023:
December 31, 2023 |
|||||
Significant Unobservable Inputs |
|
Input Range |
|
Weighted Average |
|
ULSD Gulf Coast Forward Curve |
$ |
$ |
|||
Historical Differential to PADD 3 Diesel |
$ |
$ |
|||
Historical Differential to PADD 5 Diesel |
$ |
$ |
|||
The Company estimated the fair value of embedded derivatives in its fueling agreements under the Zero Now truck financing program based on the following inputs as of December 31, 2023 and 2024:
December 31, 2023 |
December 31, 2024 |
|||||||||
Significant Unobservable Inputs |
|
Input Range |
|
Weighted Average |
|
Input Range |
|
Weighted Average |
||
ULSD Gulf Coast Forward Curve |
$ |
$ |
$ |
$ |
||||||
Historical Differential to PADD 3 Diesel |
$ |
$ |
$ |
$ |
||||||
Historical Differential to PADD 5 Diesel |
$ |
$ |
$ |
$ |
||||||
Convertible Promissory Note
In connection with the Company’s loan commitment (See Note 14) to Rimere, LLC (“Rimere”), an equity method investee, the Company acquired convertible promissory notes with aggregate principal balances equaling the total amount of drawdowns on the loan commitments. In addition, in May 2024, the Company invested in a convertible promissory note with a principal balance of $
83
CLEAN ENERGY FUELS CORP. AND SUBSIDIARIES
NOTES TO CONSOLIDATED FINANCIAL STATEMENTS (Continued)
The following table provides quantitative information about the significant inputs used to estimate the fair value of the convertible promissory notes from Rimere as of December 31, 2023 and 2024:
Significant Unobservable Inputs |
|
December 31, 2023 |
|
December 31, 2024 |
Risk-free interest rate |
||||
Credit adjustment |
||||
Credit adjusted discount rate |
The following table provides quantitative information about the significant inputs used to estimate the fair value of the convertible promissory note from BTR as of December 31, 2024:
Significant Unobservable Inputs |
|
December 31, 2024 |
Risk-free interest rate |
||
Credit adjustment |
||
Credit adjusted discount rate |
The above significant unobservable inputs are subject to change based on changes in economic and market conditions. The use of significant unobservable inputs creates uncertainty in the measurement of fair value as of the reporting date. Significant increase or decrease in any of those inputs in isolation would result in a significantly lower or higher fair value measurement. Generally, a change in market interest rates is accompanied by a directionally opposite change in the estimated fair value of fixed-rate debt securities. The Company records changes in the fair value of available-for-sale debt securities in “Unrealized gain (loss) on available-for-sale securities” within other comprehensive income (loss) in the accompanying consolidated statements of comprehensive loss. In addition, because the Company has reduced its equity method investment in the investee to zero but has other investment in the investee such as the convertible promissory note, the remeasurement to fair value is applied to the convertible promissory note’s adjusted carrying balance after the recognition of equity method losses, which is calculated based on the Company’s percentage ownership interest in such other investment.
There were
The following tables provide information by level for assets and liabilities that are measured at fair value on a recurring basis as of December 31, 2023 and 2024 (in thousands):
|
December 31, 2023 |
|
Level 1 |
|
Level 2 |
|
Level 3 |
|||||
Assets: |
|
|
|
|
|
|
|
|
||||
Available-for-sale securities: |
|
|
|
|
|
|
|
|
||||
U.S. government securities(1) |
$ |
|
$ |
|
$ |
|
$ |
|
||||
Convertible promissory notes(4) |
|
|
|
|
|
|
|
|
||||
Certificates of deposit (1) |
|
|
|
|
|
|
|
|
||||
Embedded derivatives (3) |
|
|
|
|
||||||||
Liabilities: |
|
|
|
|
|
|
|
|||||
Commodity swap contracts (2) |
$ |
|
$ |
|
$ |
|
$ |
|
||||
84
CLEAN ENERGY FUELS CORP. AND SUBSIDIARIES
NOTES TO CONSOLIDATED FINANCIAL STATEMENTS (Continued)
|
December 31, 2024 |
|
Level 1 |
|
Level 2 |
|
Level 3 |
|||||
Assets: |
|
|
|
|
|
|
|
|
||||
Available-for-sale securities: |
|
|
|
|
|
|
|
|
||||
U.S. government securities(1) |
$ |
|
$ |
|
$ |
|
$ |
|
||||
Convertible promissory notes(4) |
|
|
|
|
||||||||
Certificates of deposit (1) |
|
|
|
|
||||||||
Embedded derivatives (3) |
$ |
|
$ |
|
$ |
|
$ |
|
||||
| (1) | Included in “Short-term investments” in the accompanying consolidated balance sheets. See Note 5 for more information. |
| (2) | Included in “Derivative liabilities, related party” and “Long-term portion of derivative liabilities, related party” as of December 31, 2023 and in “Derivative liabilities, related party” as of December 31, 2024 in the accompanying consolidated balance sheets. See Note 6 for more information. |
| (3) | Included in “Prepaid expenses and other current assets” and “Notes receivable and other long-term assets, net” as of December 31, 2023 and 2024 in the accompanying consolidated balance sheets. See Note 6 for more information. |
| (4) | Included in “Notes receivable – related party” as of December 31, 2023 and 2024 in the accompanying consolidated balance sheets. |
The following table provides a reconciliation of the beginning and ending balances of items measured at fair value on a recurring basis as shown in the tables above that used significant unobservable inputs (Level 3), as well as the change in unrealized gains or losses for the periods included in earnings or other comprehensive income (loss) (in thousands):
Assets: |
Assets: |
Liabilities: |
|||||||
Embedded |
Convertible |
Commodity |
|||||||
|
Derivatives |
Promissory Notes |
Swap Contracts |
||||||
Balance as of December 31, 2022 |
$ |
|
$ |
|
$ |
( |
|||
Settlements, net |
— |
— |
|
||||||
( |
|
( |
|||||||
Purchases |
— |
|
— |
||||||
Equity method investment loss(1) |
— |
( |
— |
||||||
Balance as of December 31, 2023 |
$ |
|
$ |
|
$ |
( |
|||
Balance as of December 31, 2023 |
$ |
|
$ |
|
$ |
( |
|||
Settlements, net |
— |
— |
|
||||||
( |
|
( |
|||||||
Purchases |
— |
|
— |
||||||
Equity method investment loss(1) |
— |
( |
— |
||||||
Balance as of December 31, 2024 |
$ |
|
$ |
|
$ |
— |
|||
$ |
( |
$ |
— |
$ |
|
||||
$ |
( |
$ |
— |
$ |
|
||||
Change in unrealized gain (loss) for the year ended December 31, 2023 included in other comprehensive income (loss) |
$ |
— |
$ |
|
$ |
— |
|||
Change in unrealized gain (loss) for the year ended December 31, 2024 included in other comprehensive income (loss) |
$ |
— |
$ |
|
$ |
— |
|||
(1) Represents the Company’s proportionate share of Rimere’s losses. These losses are recorded as adjustments to the carrying value of the convertible promissory notes because the Company’s equity investment in Rimere had been reduced to zero.
85
CLEAN ENERGY FUELS CORP. AND SUBSIDIARIES
NOTES TO CONSOLIDATED FINANCIAL STATEMENTS (Continued)
Other Financial Assets and Liabilities
The carrying amounts of the Company’s cash, cash equivalents, receivables and payables approximate fair value due to the short-term nature of those instruments.
Debt instruments as of December 31, 2023 consisted of the following (in thousands):
Net Carrying |
Estimated |
|||||
|
Amounts |
Fair Value |
||||
Stonepeak Term Loan |
$ |
|
$ |
|
||
Other Debt |
|
|
||||
Total Debt |
$ |
|
$ |
|
||
Debt instruments as of December 31, 2024 consisted of the following (in thousands):
Net Carrying |
Estimated |
|||||
|
Amounts |
Fair Value |
||||
Stonepeak Term Loan |
$ |
|
$ |
|
||
Other Debt |
|
|
||||
Total Debt |
$ |
|
$ |
|
||
The fair values of these debt instruments were estimated using a DCF analysis based on imputed interest rates, which are Level 3 inputs. See Note 11 for more information about the Company’s debt instruments.
Note 8 —Other Receivables
Other receivables as of December 31, 2023 and 2024 consisted of the following (in thousands):
December 31, |
|
December 31, |
||||
2023 |
|
2024 |
||||
Loans to customers to finance vehicle purchases |
$ |
|
$ |
|
||
Accrued customer billings |
|
|
|
|
||
Fuel tax credits |
|
|
|
|
||
Other |
|
|
|
|
||
Total other receivables |
$ |
|
$ |
|
||
Note 9 —Land, Property and Equipment
Land, property and equipment, net as of December 31, 2023 and 2024 consisted of the following (in thousands):
|
December 31, |
|
December 31, |
|||
|
2023 |
|
2024 |
|||
Land |
$ |
|
$ |
|
||
LNG liquefaction plants |
|
|
|
|
||
Station equipment |
|
|
|
|
||
Trailers |
|
|
|
|
||
Other equipment |
|
|
|
|
||
Construction in progress |
|
|
|
|
||
|
|
|
|
|||
Less accumulated depreciation |
|
( |
|
( |
||
Total land, property and equipment, net |
$ |
|
$ |
|
||
86
CLEAN ENERGY FUELS CORP. AND SUBSIDIARIES
NOTES TO CONSOLIDATED FINANCIAL STATEMENTS (Continued)
Included in “Land, property and equipment, net” are capitalized software costs of $
The Company recorded amortization expense related to the capitalized software costs of $
As of December 31, 2023 and 2024, $
Note 10 —Accrued Liabilities
Accrued liabilities as of December 31, 2023 and 2024 consisted of the following (in thousands):
December 31, |
December 31, |
|||||
|
2023 |
|
2024 |
|||
Accrued alternative fuels incentives (1) |
$ |
|
$ |
|
||
Accrued employee benefits |
|
|
|
|
||
Accrued gas and equipment purchases |
|
|
|
|
||
Accrued interest |
|
|
|
|
||
Accrued property and other taxes |
|
|
|
|
||
Accrued salaries and wages |
|
|
|
|
||
Other (2) |
|
|
|
|
||
Total accrued liabilities |
$ |
|
$ |
|
||
| (1) | Includes amount for RINs, LCFS Credits, and AFTC payable to third parties. |
| (2) |
No individual item in “Other” exceeds |
Note 11 —Debt
Debt obligations as of December 31, 2023 and 2024 consisted of the following (in thousands):
December 31, 2023 |
|||||||||
|
|
Unamortized Debt |
|
Balance, Net of |
|||||
Principal Balance |
Financing Costs |
Financing Costs |
|||||||
Stonepeak Term Loan |
$ |
|
|
$ |
|
$ |
|
||
Other debt |
|
|
|
— |
|
|
|||
Total debt |
|
|
|
|
|
|
|||
Less amounts due within one year |
|
( |
|
— |
|
( |
|||
Total long-term debt |
$ |
|
$ |
|
$ |
|
|||
87
CLEAN ENERGY FUELS CORP. AND SUBSIDIARIES
NOTES TO CONSOLIDATED FINANCIAL STATEMENTS (Continued)
December 31, 2024 |
|||||||||
|
|
Unamortized Debt |
|
Balance, Net of |
|||||
Principal Balance |
Financing Costs |
Financing Costs |
|||||||
Stonepeak Term Loan |
$ |
|
$ |
|
$ |
|
|||
Other debt |
|
|
— |
|
|||||
Total debt |
|
|
|
|
|
|
|||
Less amounts due within one year |
|
( |
— |
( |
|||||
Total long-term debt |
$ |
|
$ |
|
$ |
|
|||
The following is a summary of the aggregate maturities of debt obligations for each of the annual periods subsequent to December 31, 2024 (in thousands):
|
2025 |
|
2026 |
|
2027 |
|
2028 |
|
2029 |
|
Thereafter |
Total |
|||||||||
Stonepeak Term Loan |
$ |
|
$ |
|
$ |
|
$ |
|
$ |
|
$ |
|
$ |
|
|||||||
Other Debt |
|
|
|
|
|
|
|
||||||||||||||
Total |
$ |
|
$ |
|
$ |
|
$ |
|
$ |
|
$ |
|
$ |
|
|||||||
Stonepeak Credit Agreement
On December 12, 2023 (the “Stonepeak Closing Date”), the Company entered into a senior secured first lien term loan credit agreement (as amended, supplemented or otherwise modified, the “Stonepeak Credit Agreement”) with Clean Energy, a wholly owned subsidiary of the Company as a borrower (the “Borrower”), the Company as parent guarantor, a syndicate of lenders including certain affiliates of Stonepeak Partners LP (“Stonepeak Partners”), and Alter Domus Products Corp., as administrative agent and collateral agent. Pursuant to the Stonepeak Credit Agreement, the lenders funded a $
The Borrower has the option to prepay all or any portion of the amounts owed prior to the maturity date, and the Loan Facility is subject to customary mandatory prepayments clauses. All prepayments and all other payments of the Loan Facility principal are subject to a call premium in the minimum amount that, when received by the lenders, would be sufficient to cause both (1) the internal rate of return for each such lender on the Loan Facility to be not less than
88
CLEAN ENERGY FUELS CORP. AND SUBSIDIARIES
NOTES TO CONSOLIDATED FINANCIAL STATEMENTS (Continued)
the Company and certain of the Company’s subsidiaries guaranteed the Borrower’s obligation owing to the lenders and the Borrower, the Company and such subsidiary guarantors granted the Agent a security interest in substantially all of their personal property to secure the payment of all amounts owed to the lenders under the Stonepeak Credit Agreement. Certain material subsidiaries of the Company will be required to join as a party to the Security Agreement from time to time after the Stonepeak Closing Date.
The Stonepeak Credit Agreement requires the Company and the Borrower to comply with a maximum total leverage ratio, a minimum interest coverage ratio and a minimum liquidity test. In addition, the Stonepeak Credit Agreement contains customary representations and warranties and affirmative and negative covenants, including covenants that limit or restrict the Company’s, the Borrower’s and their subsidiaries ability to incur liens, incur indebtedness, dispose of assets, make investments, make certain restricted payments, merge or consolidate and enter into certain speculative hedging arrangements. Additionally, the Stonepeak Credit Agreement includes a number of events of default contingency clauses, including, among other things, non-payment defaults, covenant defaults, cross-defaults to other materials indebtedness, bankruptcy and insolvency defaults, material judgment defaults, and material breaches of material contracts. If any event of default occurs (subject, in certain instances, to specified grace periods), the principal, premium, if any, interest and any other monetary obligations on all the then outstanding amounts under the Loan Facility may become due and payable immediately.
Concurrent with the execution of the Stonepeak Credit Agreement, the Company issued warrants to Stonepeak CLNE-W Holdings LP (“Stonepeak”), an affiliate of Stonepeak Partners, pursuant to a Warrant Agreement, dated December 12, 2023, allowing Stonepeak to purchase
Riverstone Credit Agreement
On December 22, 2022 (the “Riverstone Closing Date”), the Company entered into a senior secured first lien term loan credit agreement (the “Riverstone Credit Agreement”) with a syndicate of lenders and Riverstone Credit Management LLC, as administrative agent and collateral agent. Pursuant to the Riverstone Credit Agreement, the lenders made a $
On December 12, 2023, concurrent with the execution of the Stonepeak Credit Agreement, the Company repaid the $
89
CLEAN ENERGY FUELS CORP. AND SUBSIDIARIES
NOTES TO CONSOLIDATED FINANCIAL STATEMENTS (Continued)
Note 12 —Stockholders’ Equity
Authorized Shares
The Company’s certificate of incorporation authorizes the issuance of
Dividend Provisions
The Company did not declare or pay any dividends during the years ended December 31, 2022, 2023 and 2024.
Voting Rights
Each holder of common stock has the right to
TotalEnergies Private Placement
On May 9, 2018, the Company entered into a stock purchase agreement (the “Purchase Agreement”) with TotalEnergies Marketing Services, S.E. (“TMS”), a wholly owned subsidiary of TotalEnergies. Pursuant to the Purchase Agreement, the Company agreed to sell and issue, and TMS agreed to purchase, up to
On June 13, 2018, the Company and TMS closed the TotalEnergies Private Placement, in which: (1) the Company issued to TMS all of the
Pursuant to the Purchase Agreement, the Company and TotalEnergies also entered into a registration rights agreement on June 13, 2018, upon the closing under the Purchase Agreement. Pursuant to the registration rights agreement, the Company filed a registration statement with the Securities and Exchange Commission to cover the resale of the shares issued and sold under the Purchase Agreement, which was declared effective on August 16, 2018, and is obligated to use its commercially reasonable efforts to maintain the effectiveness of such registration statement until all such shares are sold or may be sold without restriction under Rule 144 under the Securities Act of 1933, as amended. As of December 31, 2024, the Company was in compliance with all of its registration covenants set forth in the registration rights agreement.
90
CLEAN ENERGY FUELS CORP. AND SUBSIDIARIES
NOTES TO CONSOLIDATED FINANCIAL STATEMENTS (Continued)
At-The-Market Offerings
On May 10, 2021, the Company entered into an equity distribution agreement with Goldman Sachs & Co. LLC, as sales agent, to sell shares of the Company’s common stock having an aggregate offering price of up to $
For the year ended December 31, 2021, the Company issued
Share Repurchase Program
On March 12, 2020, the Company’s Board of Directors approved a share repurchase program of up to $
Stock-Based Compensation
The following table summarizes the compensation expense and related income tax benefit related to the Company’s stock-based compensation arrangements recognized in the accompanying consolidated statements of operations during the periods presented (in thousands):
Year Ended December 31, |
|||||||||
|
2022 |
|
2023 |
|
2024 |
||||
Stock-based compensation expense, net of $ |
$ |
|
$ |
|
$ |
|
|||
Equity Incentive Plans
In December 2006, the Company adopted its 2006 Equity Incentive Plan (“2006 Plan”), which became effective on May 24, 2007, the date the Company completed its initial public offering of common stock.
91
CLEAN ENERGY FUELS CORP. AND SUBSIDIARIES
NOTES TO CONSOLIDATED FINANCIAL STATEMENTS (Continued)
In May 2016, the Company adopted its 2016 Performance Incentive Plan (“2016 Plan”), which became effective on May 26, 2016, the date of approval of the 2016 Plan by the Company’s stockholders. The 2006 Plan became unavailable for new awards upon the effectiveness of the 2016 Plan. Unissued awards under the 2006 Plan are not available for future grant under the 2016 Plan. If any outstanding award under the 2006 Plan expires or is canceled, the shares allocable to the unexercised portion of that award will be added to the share reserve under the 2016 Plan and will be available for grant under the 2016 Plan.
In May 2020, the Company adopted its Amended and Restated 2016 Performance Incentive Plan (“Amended 2016 Plan”), which increased the aggregate number of shares of the Company’s common stock to be delivered pursuant to all awards granted under the 2016 Performance Incentive Plan by an additional
In May 2024, the Company adopted its 2024 Performance Incentive Plan (“2024 Plan”), which became effective on May 20, 2024, the date of approval of the 2024 Plan by the Company’s stockholders. The 2016 Plan became unavailable for new awards upon the effectiveness of the 2024 Plan. Unissued awards under the 2016 Plan will be added to the share reserve under the 2024 Plan and will be available for grant under the 2024 Plan. If any outstanding award under the 2006 or 2016 Plan expires or is canceled, the shares allocable to the unexercised portion of that award will be added to the share reserve under the 2024 Plan and will be available for grant under the 2024 Plan. As of December 31, 2024, the Company had
Service-Based Stock Options
The Company has granted service-based stock options to key employees that vest annually over the
The following table summarizes the Company’s service-based stock option activities for the year ended December 31, 2024:
Weighted |
||||||||||
Average |
||||||||||
Weighted |
Remaining |
Aggregate |
||||||||
Average |
Contractual |
Intrinsic |
||||||||
Number of |
Exercise |
Term |
Value |
|||||||
|
Shares |
|
Price |
|
(in years) |
|
(in thousands) |
|||
Options outstanding as of December 31, 2023 |
|
|
$ |
|
|
|
|
|
||
Granted |
|
|
$ |
|
||||||
Exercised |
|
( |
$ |
|
||||||
Forfeited or expired |
|
( |
$ |
|
||||||
Options outstanding as of December 31, 2024 |
|
|
$ |
|
$ |
|
||||
Options exercisable as of December 31, 2024 |
|
|
$ |
|
$ |
|
||||
Options vested and expected to vest as of December 31, 2024 |
|
|
$ |
|
$ |
|
||||
As of December 31, 2024, there was $
92
CLEAN ENERGY FUELS CORP. AND SUBSIDIARIES
NOTES TO CONSOLIDATED FINANCIAL STATEMENTS (Continued)
The fair value of each service-based stock option granted was estimated as of the date of grant using the Black-Scholes option pricing model and using the following assumptions:
Year Ended December 31, |
||||||
|
2022 |
|
2023 |
|
2024 |
|
Dividend yield |
|
|||||
Expected volatility |
|
|||||
Risk-free interest rate |
|
|||||
Expected life in years |
|
|
|
|||
The volatility amounts used were estimated based on the historical volatility of the Company’s common stock over a term equal to the estimated life of the options. The expected lives used were based on historical exercise experience and the Company’s anticipated exercise periods for its outstanding stock options. The risk-free interest rates used were based on the U.S. Treasury yield curve with terms approximating the expected life of the stock options at the time of grant.
The weighted-average grant date fair value per share of service-based stock options granted during the years ended December 31, 2022, 2023 and 2024 were $
Performance-Based Stock Options
The Company granted
The following table summarizes the Company’s performance-based stock option activities for the year ended December 31, 2024:
Weighted |
||||||||||
Average |
||||||||||
Weighted |
Remaining |
Aggregate |
||||||||
Average |
Contractual |
Intrinsic |
||||||||
Number of |
Exercise |
Term |
Value |
|||||||
|
Shares |
|
Price |
|
(in years) |
|
(in thousands) |
|||
Options outstanding as of December 31, 2023 |
|
|
$ |
|
|
|
|
|||
Granted |
|
— |
$ |
|
||||||
Exercised |
|
— |
$ |
|
||||||
Forfeited or expired |
|
( |
$ |
|
||||||
Options outstanding as of December 31, 2024 |
|
|
$ |
|
$ |
|
||||
Options vested and exercisable as of December 31, 2024 |
|
|
$ |
|
$ |
|
||||
93
CLEAN ENERGY FUELS CORP. AND SUBSIDIARIES
NOTES TO CONSOLIDATED FINANCIAL STATEMENTS (Continued)
As of December 31, 2024, there was $
The fair value of each performance-based stock option granted was estimated as of the date of grant using the Black-Scholes option pricing model and using the following assumptions:
|
December 7, 2021 |
|
Dividend yield |
||
Expected volatility |
||
Risk-free interest rate |
||
Expected life in years |
The volatility amount used was estimated based on (i) the historical volatility of the Company’s common stock over a term equal to the estimated life of the options and on (ii) implied volatility of the Company’s traded options. The expected life used was based on historical exercise experience and the Company’s anticipated exercise period for its outstanding performance-based stock options. The risk-free interest rate used was based on the U.S. Treasury yield curve with terms approximating the expected life of the stock options at the time of grant.
The weighted-average grant date fair value per share of performance-based stock options granted during the year ended December 31, 2021 was $
Market-Based Stock Options
The Company granted
94
CLEAN ENERGY FUELS CORP. AND SUBSIDIARIES
NOTES TO CONSOLIDATED FINANCIAL STATEMENTS (Continued)
The following table summarizes the Company’s market-based stock option activities for the year ended December 31, 2024:
Weighted |
||||||||||
Average |
||||||||||
Weighted |
Remaining |
Aggregate |
||||||||
Average |
Contractual |
Intrinsic |
||||||||
Number of |
Exercise |
Term |
Value |
|||||||
|
Shares |
|
Price |
|
(in years) |
|
(in thousands) |
|||
Options outstanding as of December 31, 2023 |
|
|
$ |
|
|
|
|
|||
Granted |
|
|
$ |
|
||||||
Exercised |
|
|
$ |
|
||||||
Forfeited or expired |
|
|
$ |
|
||||||
Options outstanding as of December 31, 2024 |
|
|
$ |
|
$ |
|
||||
Options vested and exercisable as of December 31, 2024 |
|
|
$ |
|
$ |
|
||||
As of December 31, 2024, there was
The fair value of each market-based stock option granted was estimated on the date of grant using the Monte Carlo simulation model. The Monte Carlo simulation method is subject to variability as certain assumptions must be made, including the derived service period, which is estimated based on likely future stock price performance and volatility of the Company’s common stock price. The fair value of each market-based stock option granted was estimated using the following assumptions:
|
December 7, 2021 |
|
Dividend yield |
||
Expected volatility |
||
Risk-free interest rate |
||
Expected life in years |
The volatility amount used was based on the historical volatility of the Company’s common stock over a term equal to the estimated life of the options. The risk-free interest rate used was based on the U.S. Treasury yield curve with terms approximating the expected life of the stock options at the time of grant. The expected life used was based on the Company’s anticipated exercise period for its outstanding market-based stock options as the simulation was run from the valuation date through the end of the contractual life of the options using weekly time steps.
The weighted-average grant date fair value per share of market-based stock options granted during the year ended December 31, 2021 was $
95
CLEAN ENERGY FUELS CORP. AND SUBSIDIARIES
NOTES TO CONSOLIDATED FINANCIAL STATEMENTS (Continued)
Service-Based Restricted Stock Units
The Company has granted service-based restricted stock units (“Service-Based RSUs”) to key employees that vest annually over the three years following the date of grant at a rate of
The following table summarizes the Company’s Service-Based RSU activities for the year ended December 31, 2024:
Weighted |
|||||
Average |
|||||
Number of |
Fair Value at |
||||
|
Shares |
|
Grant Date |
||
RSU outstanding and unvested as of December 31, 2023 |
|
|
$ |
|
|
Granted |
|
|
$ |
|
|
Vested |
|
( |
$ |
|
|
Forfeited or expired |
|
( |
$ |
|
|
RSU outstanding and unvested as of December 31, 2024 |
|
|
$ |
|
|
The weighted average grant-date fair value of RSUs granted during the years ended December 31, 2022, 2023 and 2024 was $
As of December 31, 2024, there was $
The Company recorded $
Employee Stock Purchase Plan
On May 7, 2013, the Company adopted an employee stock purchase plan (the “2013 ESPP”), pursuant to which eligible employees may purchase shares of the Company’s common stock at
The Company recorded $
96
CLEAN ENERGY FUELS CORP. AND SUBSIDIARIES
NOTES TO CONSOLIDATED FINANCIAL STATEMENTS (Continued)
Amazon Warrant
On April 16, 2021, the Company entered into a Project Addendum to Fuel Pricing Agreement (“Fuel Agreement”) with Amazon Logistics, Inc., a subsidiary of Amazon.com, Inc. (“Amazon”), and a Transaction Agreement with Amazon (the “Transaction Agreement”), pursuant to which, among other things, the Company issued to Amazon.com NV Investment Holdings LLC, a subsidiary of Amazon (“Amazon Holdings”), a warrant to purchase up to an aggregate of
The Warrant Shares vest in multiple tranches, the first of which for
Under the Transaction Agreement, the Company was required to use commercially reasonable efforts to obtain the approval of its stockholders with respect to the issuance of Warrant Shares in excess of
As a result of the issuance of additional shares of common stock under the ATM Programs and in accordance with the terms of the warrant, on June 14, 2021, the number of shares of the Company’s common stock that may be purchased pursuant to the warrant, at an exercise price of $
Amazon Holdings may not exercise the Amazon Warrant to the extent such exercise would cause Amazon Holdings to beneficially own more than
Non-cash stock-based sales incentive contra-revenue charges (“Amazon Warrant Charges”) associated with the Amazon Warrant are recognized as the customer purchases fuel and vesting conditions become probable of being achieved based on the grant date fair value of the Amazon Warrant. The fair values of the Amazon Warrant were determined as of the grant date in accordance with ASC 718, Compensation – Stock Compensation, using the Black-Scholes option pricing model and the following assumptions:
|
April 16, 2021 |
|
June 14, 2021 |
|
Dividend yield |
|
|||
Expected volatility |
|
|||
Risk-free interest rate |
|
|||
Expected term in years |
|
|
97
CLEAN ENERGY FUELS CORP. AND SUBSIDIARIES
NOTES TO CONSOLIDATED FINANCIAL STATEMENTS (Continued)
The volatility amounts used were estimated based on the historical volatility of the Company’s common stock over a period matching the assumed term of the Amazon Warrant. The expected terms used were based on the term of the Amazon Warrant at the date of issuance. The risk-free interest rates used were based on the U.S. Treasury yield curve for the expected term of the Amazon Warrant at the date of issuance.
The following table summarizes the Amazon Warrant activities for the year ended December 31, 2024:
Warrant |
||
|
Shares |
|
Outstanding and unvested as of December 31, 2023 |
|
|
Granted |
|
|
Vested |
|
( |
Outstanding and unvested as of December 31, 2024 |
|
|
As a result of the immediate vesting of a portion of the Warrant Shares and Additional Warrant Shares, the Company recognized Amazon Warrant Charges, in the second quarter of 2021, of $
During the years ended December 31, 2022, 2023 and 2024, Amazon Warrant Charges in the consolidated statements of operations were $
Stonepeak Warrant
In connection with the Stonepeak Credit Agreement and the related Loan Facility (see Note 11), on December 12, 2023, the Company issued warrants (the “Stonepeak Warrant”) to Stonepeak, pursuant to a warrant agreement, dated December 12, 2023 (the “Warrant Agreement”), allowing Stonepeak to purchase
The Stonepeak Warrant vested upon the execution of the Warrant Agreement and is exercisable at any time after December 12, 2025. The Stonepeak Warrant has an year term, and the right to exercise the warrants expires on June 15, 2032. The Stonepeak Warrant contains a “cashless exercise” feature that allows the holder(s) to exercise the warrants without a cash payment to the Company upon the terms set forth in the Warrant Agreement. The number of shares of the Company’s common stock for which the Stonepeak Warrant is exercisable and the associated exercise price are subject to certain customary anti-dilution and continuity adjustments as set forth in the Warrant Agreement.
Stonepeak may not exercise the Stonepeak Warrant to the extent such exercise would cause Stonepeak to beneficially own more than
The Stonepeak Warrant, issued in conjunction with the funding of the Senior Term Loan, was determined to be a separate unit of account from the Loan Facility based on evaluation of the contractual terms of the Stonepeak Credit
98
CLEAN ENERGY FUELS CORP. AND SUBSIDIARIES
NOTES TO CONSOLIDATED FINANCIAL STATEMENTS (Continued)
Agreement and the Warrant Agreement. As a result, amounts were allocated to the Stonepeak Warrant using the relative fair value method. The Stonepeak Warrant is deemed an equity classified instrument because the underlying warrants (1) do not embody an obligation of the Company, (2) are deemed to be indexed to the Company’s own common stock, and (3) meet all the conditions for equity classification. As such, the Stonepeak Warrant is measured at fair value as of the issuance date, and subsequent changes in fair value will not be recognized in earnings. The fair values of the Stonepeak Warrant as of the issuance date were determined using the Black-Scholes option pricing model and the following assumptions:
|
December 12, 2023 |
|
December 12, 2023 |
|
Exercise price |
||||
Dividend yield |
|
|||
Expected volatility |
|
|||
Risk-free interest rate |
|
|||
Expected term in years |
|
|
The volatility amounts used were estimated based on the historical volatility of the Company’s common stock over a period matching the assumed term of the Stonepeak Warrant. The expected terms used were based on the term of the Stonepeak Warrant on the date of issuance. The risk-free interest rates used were based on the U.S. Treasury yield curve for the expected term of the Stonepeak Warrant on the date of issuance.
As a result of the issuance and vesting of the Stonepeak Warrant, the Company recognized $
The following table summarizes the Stonepeak Warrant activities for the year ended December 31, 2024:
Warrant |
||
|
Shares |
|
Outstanding and unexercised as of December 31, 2023 |
|
|
Granted |
|
|
Exercised |
|
|
Outstanding and unexercised as of December 31, 2024 |
|
|
99
CLEAN ENERGY FUELS CORP. AND SUBSIDIARIES
NOTES TO CONSOLIDATED FINANCIAL STATEMENTS (Continued)
Note 13 —Income Taxes
The components of loss before income taxes for the years ended December 31, 2022, 2023 and 2024 are as follows (in thousands):
|
2022 |
|
2023 |
|
2024 |
||||
U.S. |
$ |
( |
$ |
( |
$ |
( |
|||
Foreign |
|
( |
|
( |
|
( |
|||
Total loss before income taxes |
$ |
( |
$ |
( |
$ |
( |
|||
The provision for income taxes for the years ended December 31, 2022, 2023 and 2024 consists of the following (in thousands):
|
2022 |
|
2023 |
|
2024 |
||||
Current: |
|
|
|
|
|
|
|||
State |
$ |
|
$ |
|
$ |
|
|||
Foreign |
|
— |
|
— |
|
— |
|||
Total current |
|
|
|
|
|
|
|||
Deferred: |
|
|
|
|
|
|
|||
Federal |
|
|
|
( |
|
|
|||
State |
|
|
|
( |
|
|
|||
Total deferred |
|
|
|
( |
|
|
|||
Total expense |
$ |
|
$ |
( |
$ |
|
|||
A reconciliation of the income tax expense for the years ended December 31, 2022, 2023 and 2024, with the amount computed using the federal income tax rate of
|
2022 |
|
2023 |
|
2024 |
||||
Computed expected tax (benefit) |
$ |
( |
$ |
( |
$ |
( |
|||
Nondeductible expenses |
|
|
|
|
|
|
|||
Tax rate differential on foreign earnings |
|
|
|
|
|
|
|||
Joint ventures |
|
|
|
|
|
|
|||
Amazon warrants |
|
|
|
|
|||||
Tax credits |
|
( |
|
( |
|
( |
|||
Other |
|
|
|
( |
|
|
|||
Change in valuation allowance |
|
|
|
|
|
|
|||
Total tax expense |
$ |
|
$ |
( |
$ |
|
|||
The Company recorded a federal tax benefit of $
100
CLEAN ENERGY FUELS CORP. AND SUBSIDIARIES
NOTES TO CONSOLIDATED FINANCIAL STATEMENTS (Continued)
Deferred tax assets and liabilities result from differences between the financial statement carrying amounts and the tax bases of existing assets and liabilities. The tax effect of temporary differences that give rise to deferred tax assets and liabilities as of December 31, 2023 and 2024 are as follows (in thousands):
|
2023 |
|
2024 |
|||
Deferred tax assets: |
|
|
|
|
||
Accrued expenses |
$ |
|
$ |
|
||
Lease obligations |
|
|
||||
Alternative minimum tax and general business credits |
|
|
|
|
||
Stock option expense |
|
|
|
|
||
Amazon warrants |
|
|
||||
Other |
|
|
|
|
||
Depreciation and amortization |
|
|
||||
Loss carryforwards |
|
|
|
|
||
Total deferred tax assets |
|
|
|
|
||
Less valuation allowance |
|
( |
|
( |
||
Net deferred tax assets |
|
|
|
|
||
Deferred tax liabilities: |
|
|
|
|
||
Right-of-use assets |
( |
( |
||||
Commodity swap contracts |
|
( |
|
( |
||
Goodwill |
|
( |
|
( |
||
Investments in joint ventures and partnerships |
|
( |
|
( |
||
Total deferred tax liabilities |
|
( |
|
( |
||
Net deferred tax liabilities |
$ |
( |
$ |
( |
||
As of December 31, 2024, the Company had federal, state and foreign net operating loss carryforwards of approximately $
In assessing the realizability of the net deferred tax assets, management considers whether it is more likely than not that some or all of the deferred tax assets will not be realized. The ultimate realization of deferred tax assets is dependent upon the generation of future taxable income during the periods in which those temporary differences become deductible. Management considers projected future taxable income and tax planning strategies in making this assessment. As of December 31, 2023 and 2024, the Company provided a valuation allowance of $
For the year ended December 31, 2024, the Company did not have any offshore earnings of certain non-U.S. subsidiaries which are permanently reinvested outside the United States.
The Company does not recognize the impact of a tax position in its financial statements unless the position is more likely than not to be sustained, based on the technical merits of the position. The Company has unrecognized tax benefits of $
101
CLEAN ENERGY FUELS CORP. AND SUBSIDIARIES
NOTES TO CONSOLIDATED FINANCIAL STATEMENTS (Continued)
The following is a tabular reconciliation of the total amounts of unrecognized tax benefits for the years ended December 31, 2022, 2023 and 2024 (in thousands):
Unrecognized tax benefit—December 31, 2022 |
|
$ |
|
Gross increases—tax positions in current year |
|
|
|
Gross increases—tax positions in prior year |
— |
||
Gross decreases—tax positions in prior year |
( |
||
Unrecognized tax benefit—December 31, 2023 |
|
||
Gross increases—tax positions in current year |
|
||
Gross increases—tax positions in prior year |
— |
||
Gross decreases—tax positions in prior year |
( |
||
Unrecognized tax benefit—December 31, 2024 |
$ |
|
The increase in the Company’s unrecognized tax benefits in the years ended December 31, 2024 and December 31, 2023 is primarily attributable to the portion of AFTC offset by the fuel tax the Company collected from its customers and the warrants issued to its customer.
ASC 740, Income Taxes, requires the Company to accrue interest and penalties where there is an underpayment of taxes based on the Company’s best estimate of the amount ultimately to be paid. The Company’s policy is to recognize interest accrued related to unrecognized tax benefits and penalties as income tax expense. The Company recognized interest and penalties related to uncertain tax positions of $
The Company is subject to taxation in the United States and various states and foreign jurisdictions. The Company’s tax years from 2020 to 2024 are subject to examination by various tax authorities. Although the Company is no longer subject to U.S. examination for years before 2021 and to state tax examinations for years before 2020, taxing authorities can adjust the net operating losses that arose in earlier years if and when the net operating losses reduce future income. In addition, the Company is required to indemnify SAFE S.p.A. for taxes that are imposed on CEC for pre-contribution tax periods.
A number of years may elapse before an uncertain tax position is finally resolved. It is often difficult to predict the final outcome or the timing of resolution of an uncertain tax position, but the Company believes that its reserves for income taxes reflect the most probable outcomes. The Company adjusts the reserve, as well as the related interest and penalties, in light of changing facts and circumstances. The amount of penalties accrued is immaterial. Settlement of any particular position would usually require the use of cash and result in the reduction of the related reserve, or there could be a change in the amount of the Company’s net operating loss. The resolution of a matter would be recognized as an adjustment to the provision for income taxes at the effective tax rate in the period of resolution. The Company does not expect a significant increase or decrease in its uncertain tax positions within the next twelve months.
On August 16, 2022, the Inflation Reduction Act of 2022 ("the IRA”) was signed into law. Besides the reinstatement of AFTC for the three year period from January 1, 2022 to December 31, 2024, the IRA offers tax incentives targeting energy transaction and renewables:
| ● | The investment tax credit under Section 48 of the Internal Revenue Code is expanded to include Qualified Biogas Property, which is expected to be available for the RNG dairy projects that the Company has invested or will invest. The investment tax credit rate could range from 6% up to a 50% bonus rate depending on meeting certain wage, apprenticeship, domestic content, and energy community requirements. |
| ● | A new tax credit under Section 45Z of the Internal Revenue Code was introduced to apply to low-emissions transportation fuel produced at a qualified facility and sold by the taxpayer after December 31, 2024 through December 31, 2027. The IRA provides a base credit of 20 cents per gallon or $1.00 per gallon multiplied by an |
102
CLEAN ENERGY FUELS CORP. AND SUBSIDIARIES
NOTES TO CONSOLIDATED FINANCIAL STATEMENTS (Continued)
| applicable emission factor if prevailing wage and apprentices requirements are met. The Company’s RNG dairy projects will be eligible for this credit at an increased rate of $1/gallon. |
| ● | The alternative fuel refueling property credit under Section 30C of the Internal Revenue Code was reinstated for 2022 and extended an additional 10 years to apply to any property placed in service before January 1, 2033. The base credit amount is 6% with a bonus rate of 30% if wage and registered apprenticeship requirements are met with a maximum credit amount of $100,000 (previously $30,000) per single refueling pump. |
The Internal Revenue Service has been granted broad authority to issue regulations or other guidance that could clarify how these taxes will be applied and credits will be eligible. The Company is continuing to evaluate the financial impact of the IRA as additional information becomes available. For the year ended December 31, 2024, four RNG projects that the Company invested in were placed in service and are eligible for the Investment Tax Credits. The Company intends to monetize the tax credits by transferring to third parties. In addition, the Company’s six RNG projects that were placed in service will be eligible for Clean Fuel Production Tax Credit beginning January 1, 2025.
Note 14 —Commitments and Contingencies
Environmental Matters
The Company is subject to federal, state, local and foreign environmental laws and regulations. The Company does not anticipate any expenditures to comply with such laws and regulations that would have a material effect on the Company’s consolidated financial position, results of operations or liquidity. The Company believes that its operations comply, in all material respects, with applicable federal, state, local and foreign environmental laws and regulations.
Litigation, Claims and Contingencies
The Company may become party to various legal actions that arise in the ordinary course of its business. The Company is also subject to audit by tax and other authorities for varying periods in various federal, state, local and foreign jurisdictions, and disputes may arise during the course of these audits. It is impossible to determine the ultimate liabilities that the Company may incur resulting from any of these lawsuits, claims, proceedings, audits, commitments, contingencies and related matters or the timing of these liabilities, if any. If these matters were to ultimately be resolved unfavorably, it is possible that such an outcome could have a material adverse effect upon the Company’s consolidated financial position, results of operations or liquidity. The Company does not, however, anticipate such an outcome and it believes the ultimate resolution of these matters will not have a material adverse effect on the Company’s consolidated financial position, results of operations or liquidity.
Long-Term Take-or-Pay Natural Gas Purchase Contracts
The Company has entered into quarterly fixed price natural gas purchase contracts with take-or-pay commitments extending through March 2025. As of December 31, 2024, the fixed commitments under these contracts totaled approximately $
Rimere Loan Commitment
In November 2022, the Company entered into a note purchase agreement (the “2022 Note Purchase Agreement”) with Rimere. Pursuant to the 2022 Note Purchase Agreement, the Company irrevocably committed to make available up to $
103
CLEAN ENERGY FUELS CORP. AND SUBSIDIARIES
NOTES TO CONSOLIDATED FINANCIAL STATEMENTS (Continued)
of December 2024. In December 2024, the 2022 Note Purchase Agreement was amended, extending the maturity date to the end of June 2025.
Concurrently, through a separately executed note purchase agreement, dated January 8, 2024 (the “2024 Note Purchase Agreement”), the Company agreed to make available up to $
Note 15 —Leases
The Company’s operating leases are related to real estate for fueling stations, office spaces, warehouses, a LNG liquefaction plant, and office equipment, and its finance leases are primarily related to vehicles.
Certain of the Company’s real estate leases contain variable lease payments, including payments based on a change in the index or gasoline gallon equivalents of natural gas dispensed at fueling stations. These variable lease payments cannot be determined at the commencement of the lease and are not included in the ROU assets and lease liabilities. As such, amounts associated with these variable lease payments are recorded as a period expense when incurred.
Lessee Accounting
As of December 31, 2023 and 2024, the Company’s finance and operating lease asset and liability balances were as follows (in thousands):
2023 |
2024 |
|||||
Finance leases: |
|
|
|
|
||
Land, property and equipment, gross |
$ |
|
$ |
|
||
Accumulated depreciation |
|
( |
|
( |
||
Land, property and equipment, net |
$ |
|
$ |
|
||
$ |
|
$ |
|
|||
|
|
|
|
|||
Total finance lease liabilities |
$ |
|
$ |
|
||
Operating leases: |
|
|
|
|
||
$ |
|
$ |
|
|||
$ |
|
$ |
|
|||
|
|
|
|
|||
Total operating lease liabilities |
$ |
|
$ |
|
||
104
CLEAN ENERGY FUELS CORP. AND SUBSIDIARIES
NOTES TO CONSOLIDATED FINANCIAL STATEMENTS (Continued)
The components of lease expense for finance and operating leases consisted of the following (in thousands):
Year Ended December 31, |
||||||
2023 |
2024 |
|||||
Finance leases: |
|
|
|
|
||
Depreciation on assets under finance leases |
$ |
|
$ |
|
||
Interest on lease liabilities |
|
|
|
|
||
Total finance leases expense |
$ |
|
$ |
|
||
Operating leases: |
|
|
|
|
||
Lease expense |
$ |
|
$ |
|
||
Lease expense on short-term leases |
|
|
|
|
||
Variable lease expense |
|
|
|
|
||
Sublease income |
|
( |
|
( |
||
Total operating leases expense |
$ |
|
$ |
|
||
Supplemental information on finance and operating leases is as follows (dollars in thousands):
Year Ended December 31, |
||||||
2023 |
2024 |
|||||
Operating cash outflows from finance leases |
$ |
|
$ |
|
||
Operating cash outflows from operating leases |
$ |
|
$ |
|
||
Financing cash outflows from finance leases |
$ |
|
$ |
|
||
Assets obtained in exchange for new finance lease liabilities (1) |
$ |
|
$ |
|
||
ROU assets obtained in exchange for operating lease liabilities (1) |
$ |
|
$ |
|
||
|
December 31, |
|
December 31, |
|
2023 |
2024 |
|||
Weighted-average remaining lease term - finance leases |
|
|
||
Weighted-average remaining lease term - operating leases |
|
|
||
Weighted-average discount rate - finance leases |
|
|
||
Weighted-average discount rate - operating leases |
|
|
| (1) | These amounts are excluded from the accompanying consolidated statements of cash flows as they are non-cash investing, operating and/or financing activities. |
The following schedule presents the Company’s maturities of finance and operating lease liabilities as of December 31, 2024 (in thousands):
Fiscal Year |
|
Finance Leases |
|
Operating Leases |
||
2025 |
$ |
|
$ |
|
||
2026 |
|
|
|
|
||
2027 |
|
|
|
|
||
2028 |
|
|
|
|
||
2029 |
|
— |
|
|
||
Thereafter |
|
— |
|
|
||
Total minimum lease payments |
|
|
|
|
||
Less amount representing interest |
|
( |
|
( |
||
Present value of lease liabilities |
$ |
|
$ |
|
||
105
CLEAN ENERGY FUELS CORP. AND SUBSIDIARIES
NOTES TO CONSOLIDATED FINANCIAL STATEMENTS (Continued)
Lessor Accounting
The Company leases fueling station equipment to customers pursuant to agreements that contain an option to extend and an end-of-term purchase option. Receivables from these leases are accounted for as finance leases, specifically sales-type leases, and are included in “Other receivables” and “Notes receivable and other long-term assets, net” in the accompanying consolidated balance sheets.
The Company recognizes the net investment in the lease as the sum of the lease receivable and the unguaranteed residual value, both of which are measured at the present value using the interest rate implicit in the lease.
During the years ended December 31, 2022, 2023 and 2024, the Company recognized $
The following schedule presents the Company’s maturities of lease receivables as of December 31, 2024 (in thousands):
Fiscal Year: |
|
|
|
2025 |
$ |
|
|
2026 |
|
|
|
2027 |
|
|
|
2028 |
|
|
|
2029 |
|
|
|
Thereafter |
|
|
|
Total minimum lease payments |
|
|
|
Less amount representing interest |
|
( |
|
Present value of lease receivables |
$ |
|
Note 16 —401(k) Plan
The Company has established a savings plan (“Savings Plan”) which is qualified under Section 401(k) of the Internal Revenue Code. Eligible employees may elect to make contributions to the Savings Plan through salary deferrals of up to
Note 17 —Net Loss Per Share
The following table sets forth the computations of basic and diluted earnings (loss) per share for the years ended December 31, 2022, 2023 and 2024 (in thousands, except share and per share amounts):
|
2022 |
|
2023 |
|
2024 |
||||
Net loss attributable to Clean Energy Fuels Corp. |
|
$ |
( |
|
$ |
( |
|
$ |
( |
Weighted-average common shares outstanding |
|
|
|
||||||
Dilutive effect of potential common shares from restricted stock units, stock options and stock warrants |
— |
— |
— |
||||||
Weighted-average common shares outstanding - diluted |
|
|
|
||||||
Basic loss per share |
$ |
( |
$ |
( |
$ |
( |
|||
Diluted loss per share |
$ |
( |
$ |
( |
$ |
( |
|||
106
CLEAN ENERGY FUELS CORP. AND SUBSIDIARIES
NOTES TO CONSOLIDATED FINANCIAL STATEMENTS (Continued)
The following potentially dilutive securities have been excluded from the diluted net loss per share calculations because their effect would have been antidilutive. Although these securities were antidilutive for these periods, they could be dilutive in future periods.
(in shares) |
|
2022 |
|
2023 |
|
2024 |
Stock options |
|
|
|
|
|
|
Stonepeak warrant shares |
|
|
|
|
|
|
Restricted stock units |
|
|
|
|
|
|
Amazon warrant shares |
|
|
|
|||
Total |
|
|
|
Note 18 —Related Party Transactions
TotalEnergies S.E.
During the years ended December 31, 2022, 2023 and 2024, the Company recognized revenue of $
During the years ended December 31, 2022, 2023 and 2024, the Company paid TotalEnergies $
SAFE S.p.A
During the years ended December 31, 2022, 2023 and 2024, the Company received $
During the years ended December 31, 2022, 2023 and 2024, the Company paid SAFE&CEC S.r.l (and its successor entity SAFE S.p.A.) $
TotalEnergies Joint Venture(s) and bpJV
Pursuant to various contractual agreements of the TotalEnergies joint venture(s) and bpJV, the Company manages day-to-day operations of RNG projects in the joint ventures in exchange for an O&M fee and management fee. For the years ended December 31, 2022, 2023 and 2024, the Company recognized management and O&M fee revenue of $
107
CLEAN ENERGY FUELS CORP. AND SUBSIDIARIES
NOTES TO CONSOLIDATED FINANCIAL STATEMENTS (Continued)
For the years ended December 31, 2022, 2023 and 2024, the Company paid $
For the years ended December 31, 2022, 2023 and 2024, the Company received $
Rimere
For the years ended December 31, 2023 and 2024, the Company provided $
For the years ended December 31, 2023 and 2024, the Company recognized management fee revenue of $
Excluding management fee revenue,
Note 19 —Reportable Segments and Geographic Information
The Company operates as
The CODM uses profitability metrics, including net income/(loss) to evaluate financial performance, as well as Cost of Sales and SG&A (excluding stock compensation) in the achievement towards the Company’s strategy, and to make key operating decisions such as the determination of the markets in which the Company seeks to make capital investments and the allocation of budget between cost of revenues, selling, general and administrative expenses.
108
CLEAN ENERGY FUELS CORP. AND SUBSIDIARIES
NOTES TO CONSOLIDATED FINANCIAL STATEMENTS (Continued)
The following table presents selected financial information with respect to the Company’s single reportable segment for the years ended December 31, 2022, 2023 and 2024. As the Company’s single reportable segment represents the consolidated entity, amounts are traceable to the Consolidated Statements of Operations.
|
|
2022 |
|
2023 |
|
2024 |
||||
Revenue: |
|
|
|
|
|
|
||||
Total revenue |
(1) |
$ |
|
$ |
|
$ |
|
|||
Cost of Sales (excluding depreciation): |
(2) |
|
|
|
||||||
Commodity product cost of sales |
|
|
|
|||||||
Other product cost of sales |
|
|
|
|||||||
Product cost of sales |
|
|
|
|||||||
Service cost of sales |
|
|
|
|||||||
Operating expenses: |
|
|
|
|
|
|
||||
Selling, general and administrative, excluding stock compensation |
|
|
|
|||||||
Stock compensation |
|
|
|
|||||||
Selling, general and administrative |
|
|
|
|||||||
Depreciation and amortization |
|
|
|
|||||||
Impairment of investments in equity securities |
— |
— |
|
|||||||
Interest |
(3) |
( |
( |
( |
||||||
Other income (expense), net |
|
|
|
|||||||
Loss from equity method investments |
( |
( |
( |
|||||||
Loss before income taxes |
( |
( |
( |
|||||||
Income tax (expense) benefit |
( |
|
( |
|||||||
Net loss |
( |
( |
( |
|||||||
Loss attribute to noncontrolling interest |
|
|
|
|
|
|||||
Net loss attribute to Clean Energy Corp. |
$ |
( |
$ |
( |
$ |
( |
| (1) | The CODM is provided revenue information disaggregated by product and service type in exactly the same manner as provided in footnote 2 - Revenue from Contracts with Customers, Disaggregation of Revenue. |
The Company had
| (2) | Costs of sales provided to the CODM are displayed here. Commodity cost of sales represents costs associated with natural gas and its transportation, and is included in the Product Cost of Sales financial statement caption on the Consolidated Statements of Operations. Total Product Cost of Sales and Service Cost of Sales reconcile to the amounts in the Consolidated Statements of Operations. |
| (3) | Interest, net is computed as the net of interest income and interest expense. Refer to the Consolidated Statements of Operations. |
|
|
2022 |
|
|
2023 |
|
|
2024 |
||
Interest expense |
$ |
( |
$ |
( |
$ |
( |
||||
Interest income |
|
|
|
|||||||
( |
( |
( |
109
CLEAN ENERGY FUELS CORP. AND SUBSIDIARIES
NOTES TO CONSOLIDATED FINANCIAL STATEMENTS (Continued)
The Company's revenue and long-lived tangible assets, including the Company's operating lease assets recognized on the consolidated balance sheets were located as follows:
|
2022 |
|
2023 |
|
2024 |
||||
Revenue: |
|
|
|
|
|
|
|||
United States |
$ |
|
$ |
|
$ |
|
|||
Canada |
|
|
|
|
|
|
|||
Total revenue |
$ |
|
$ |
|
$ |
|
|||
Long-lived assets: |
|
|
|
|
|
|
|||
United States |
$ |
|
$ |
|
$ |
|
|||
Canada |
|
|
|
|
|
|
|||
Total long-lived assets |
$ |
|
$ |
|
$ |
|
|||
Note 20 —Concentrations
During the years ended December 31, 2022, 2023 and 2024,
During the years ended December 31, 2022 and 2023,
Note 21 – Subsequent Event
On January 20, 2025, the Company received notice from Pilot Travel Centers, LLC (“Pilot”) of non-renewal of the Liquified Natural Gas Fueling Station and LNG Master Sales Agreement, dated August 2, 2010 (“the agreement” or “Pilot Agreement”), which expires August 1, 2025, in accordance with the agreement. In the correspondence, Pilot indicated the willingness to negotiate terms to a new agreement.
If a new agreement is not reached, the Company would abandon and remove its assets located at
110
Item 9. Changes in and Disagreements with Accountants on Accounting and Financial Disclosure.
None.
Item 9A. Controls and Procedures.
Evaluation of Disclosure Controls and Procedures
We maintain disclosure controls and procedures that are designed to ensure that information required to be disclosed in the reports that we file or submit under the Securities Exchange Act of 1934, as amended (the “Exchange Act”) is recorded, processed, summarized and reported within the time periods specified in the rules and forms of the Securities and Exchange Commission, and that such information is accumulated and communicated to our management, including our Chief Executive Officer and Chief Financial Officer, as appropriate to allow timely decisions regarding required disclosure.
Our management carried out an evaluation, with the participation of our Chief Executive Officer and Chief Financial Officer (our principal executive and principal financial officers, respectively), of the effectiveness of our disclosure controls and procedures as of December 31, 2024, the end of the period covered by this report. Based on this evaluation, our Chief Executive Officer and Chief Financial Officer concluded that our disclosure controls and procedures were effective as of December 31, 2024.
Changes in Internal Control Over Financial Reporting
We regularly review and evaluate our internal control over financial reporting, and from time to time we may make changes to our processes and systems to improve controls or increase efficiencies. Such changes may include, among others, implementing new and more efficient systems, consolidating activities, and migrating processes.
There were no changes in our internal control over financial reporting that occurred during the quarter ended December 31, 2024 that have materially affected, or are reasonably likely to materially affect, our internal control over financial reporting.
Management’s Report on Internal Control Over Financial Reporting
Our management is responsible for establishing and maintaining adequate internal control over financial reporting (as defined in Rule 13a-15(f) under the Exchange Act) for our Company. Our management, with the participation of our Chief Executive Officer and Chief Financial Officer, assessed the effectiveness of our internal control over financial reporting as of December 31, 2024. In making this assessment, our management used the criteria set forth by the Committee of Sponsoring Organizations of the Treadway Commission in Internal Control—Integrated Framework (2013). Based on this assessment, our management concluded that, as of December 31, 2024, our internal control over financial reporting was effective. Our independent registered public accounting firm, KPMG LLP, has issued an attestation report on our internal control over financial reporting, which is included in Item 8. “Financial Statements and Supplementary Data” of this report.
Inherent Limitations of Disclosure Controls and Procedures and Internal Control Over Financial Reporting
In designing our disclosure controls and procedures and internal control over financial reporting, management recognizes that any controls and procedures, no matter how well-designed and operated, can provide only reasonable assurance of achieving the desired control objectives. In addition, the design of our controls and procedures must reflect the fact that there are resource constraints, and management necessarily applies its judgment in evaluating the benefits of possible controls and procedures relative to their costs. Because of these inherent limitations, our disclosure and internal controls may not prevent or detect all instances of fraud, misstatements or other control issues. In addition, projections of any evaluation of the effectiveness of disclosure or internal controls to future periods are subject to risks, including, among others, that controls may become inadequate because of changes in conditions or that compliance with policies or procedures may deteriorate.
Item 9B. Other Information.
Item 9C. Disclosure Regarding Foreign Jurisdictions that Prevent Inspections.
Not applicable.
111
PART III
Item 10. Directors, Executive Officers and Corporate Governance.
We have
The remaining information required by Item 10 is incorporated by reference to our definitive proxy statement for our 2024 annual meeting of stockholders to be filed with the SEC within 120 days after the end of our fiscal year ended December 31, 2024.
Item 11. Executive Compensation.
The information required by Item 11 is incorporated by reference to our definitive proxy statement for our 2025 annual meeting of stockholders to be filed with the SEC within 120 days after the end of our fiscal year ended December 31, 2024.
Item 12. Security Ownership of Certain Beneficial Owners and Management and Related Stockholder Matters.
The information required by Item 12 is incorporated by reference to our definitive proxy statement for our 2025 annual meeting of stockholders to be filed with the SEC within 120 days after the end of our fiscal year ended December 31, 2024.
Item 13. Certain Relationships and Related Transactions, and Director Independence.
The information required by Item 13 is incorporated by reference to our definitive proxy statement for our 2025 annual meeting of stockholders to be filed with the SEC within 120 days after the end of our fiscal year ended December 31, 2024.
Item 14. Principal Accountant Fees and Services.
Our independent registered public accounting firm is
The information required by Item 14 is incorporated by reference to our definitive proxy statement for our 2025 annual meeting of stockholders to be filed with the SEC within 120 days after the end of our fiscal year ended December 31, 2024.
112
PART IV
Item 15. Exhibits and Financial Statement Schedules.
(a)(1) Consolidated Financial Statements
The following items are filed in Item 8. Financial Statements and Supplementary Data of this report:
Report of Independent Registered Public Accounting Firm |
Consolidated Balance Sheets |
Consolidated Statements of Operations |
Consolidated Statements of Comprehensive Income (Loss) |
Consolidated Statements of Stockholders’ Equity |
Consolidated Statements of Cash Flows |
Notes to Consolidated Financial Statements |
(a)(2) Financial Statement Schedules
The financial statement schedule set forth below is filed as a part of this report. All other schedules have been omitted because they are not required, not applicable, or the required information is otherwise included.
Schedule II - Valuation and Qualifying Accounts
(In thousands) |
||||||
|
Allowance for |
|
Allowance for |
|||
Credit Losses |
Credit Losses |
|||||
on Accounts |
on Notes |
|||||
Receivables |
Receivables |
|||||
Balance as of December 31, 2021 |
$ |
|
$ |
|
||
Charges (benefit) to operations |
|
|
|
|
||
Deductions |
|
( |
|
— |
||
Balance as of December 31, 2022 |
|
|
|
|
||
Charges (benefit) to operations |
|
|
|
|
||
Deductions |
|
( |
|
— |
||
Balance as of December 31, 2023 |
|
|
|
|
||
Charges (benefit) to operations |
|
|
|
— |
||
Deductions |
|
( |
|
— |
||
Balance as of December 31, 2024 |
$ |
|
$ |
|
||
(a)(3) Exhibits
The information required by this Item 15(a)(3) is set forth on the exhibit index, which immediately precedes the signature page to this report and is incorporated herein by reference.
Item 16. Form 10-K Summary.
We have elected not to provide summary information.
113
EXHIBIT INDEX
Exhibit |
|
|
Incorporated by Reference |
|||
|---|---|---|---|---|---|---|
Number |
Description |
Form |
|
Filing Date |
||
3.1 |
Filed as Exhibit 3.1 to the Quarterly Report on Form 10-Q for the quarter ended June 30, 2018. |
August 7, 2018 |
||||
|
||||||
3.1.1 |
Filed as Exhibit 3.1.1 to the Quarterly Report on Form 10-Q for the quarter ended June 30, 2018. |
August 7, 2018 |
||||
|
||||||
3.1.2 |
Certificate of Amendment to Restated Certificate of Incorporation, dated June 14, 2021. |
Filed as Exhibit 3.1 to the Current Report on Form 8-K |
June 15, 2021 |
|||
|
||||||
3.2 |
Filed as Exhibit 3.2 to the Current Report on Form 8-K. |
February 23, 2011 |
||||
|
||||||
3.2.1 |
Filed as Exhibit 3.2.1 to the Current Report on Form 8-K. |
February 27, 2014 |
||||
|
||||||
4.1 |
Filed as Exhibit 4.1 to the Registration Statement on Form S-1, as amended. |
March 27, 2007 |
||||
|
||||||
4.3 |
Filed as Exhibit 4.3 to the Annual Report on Form 10-K for the year ended December 31, 2021. |
February 24, 2022 |
||||
|
||||||
4.4† |
Filed as Exhibit 4.4 to the Current Report on Form 8-K. |
April 19, 2021 |
||||
4.5 |
Filed as Exhibit 10.3 to the Current Report on Form 8-K. |
December 13, 2023 |
||||
114
Exhibit |
|
|
Incorporated by Reference |
|||
|---|---|---|---|---|---|---|
Number |
Description |
Form |
|
Filing Date |
||
10.1+ |
Filed as Exhibit 10.1 to the Quarterly Report on Form 10-Q for the quarter ended September 30, 2024 |
November 6, 2024 |
||||
|
||||||
10.2†† |
Filed as Exhibit 10.3 to the Annual Report on Form 10-K for the year ended December 31, 2021 |
February 24, 2022 |
||||
|
||||||
10.3 |
Filed as Exhibit 10.4 to the Annual Report on Form 10-K for the year ended December 31, 2021 |
February 24, 2022 |
||||
10.4+ |
Filed as Exhibit 10.63 to the Annual Report on Form 10-K for the year ended December 31, 2011. |
March 12, 2012 |
||||
|
||||||
10.5+ |
2006 Equity Incentive Plan - Form of Notice of Stock Option Grant. |
Filed as Exhibit 10.104 to the Quarterly Report on Form 10-Q for the quarter ended March 31, 2015. |
May 11, 2015 |
|||
|
||||||
10.6+ |
2006 Equity Incentive Plan—Form of Notice of Stock Option Grant and Stock Option Agreement. |
Filed as Exhibit 99.5 to the Registration Statement on Form S-8. |
August 14, 2007 |
|||
10.7+ |
Filed as Exhibit 10.106 to the Current Report on Form 8-K. |
December 31, 2015 |
||||
|
||||||
10.8+ |
Filed as Exhibit 10.107 to the Current Report on Form 8-K. |
December 31, 2015 |
||||
|
||||||
10.9+ |
Filed as Exhibit 10.109 to the Current Report on Form 8-K. |
December 31, 2015 |
||||
|
||||||
10.10+ |
Filed as Exhibit 10.114 to the Current Report on Form 8-K. |
May 27, 2016 |
||||
|
||||||
115
Exhibit |
|
|
Incorporated by Reference |
|||
|---|---|---|---|---|---|---|
Number |
Description |
Form |
|
Filing Date |
||
10.11+ |
Filed as Exhibit 10.117 to the Quarterly Report on Form 10-Q for the quarter ended June 30, 2016. |
August 9, 2016 |
||||
|
||||||
10.12+ |
Filed as Exhibit 10.118 to the Quarterly Report on Form 10-Q for the quarter ended June 30, 2016. |
August 9, 2016 |
||||
|
||||||
10.13 |
Filed as Exhibit 10.122 to the Quarterly Report on Form 10-Q for the quarter ended September 30, 2017. |
November 2, 2017 |
||||
|
||||||
10.14 |
Filed as Exhibit 10.125 to the Quarterly Report on Form 10-Q for the quarter ended March 31, 2018. |
May 10, 2018 |
||||
|
||||||
10.15 |
Filed as Exhibit 10.126 to the Quarterly Report on Form 10-Q for the quarter ended March 31, 2018. |
May 10, 2018 |
||||
|
||||||
10.16 |
Filed as Exhibit 10.127 to the Quarterly Report on Form 10-Q for the quarter ended March 31, 2018. |
May 10, 2018 |
||||
|
||||||
10.17 |
Filed as Exhibit 10.130 to the Annual Report on Form 10-K for the year ended December 31, 2018. |
March 12, 2019 |
||||
|
||||||
10.18 |
Filed as Exhibit 10.1 to the Current Report on Form 8-K. |
May 18, 2020 |
||||
|
||||||
10.19†† |
Filed as Exhibit 10.24 to the Annual Report on Form 10-K for the year ended December 31, 2020. |
March 9, 2021 |
||||
|
||||||
116
Exhibit |
|
|
Incorporated by Reference |
|||
|---|---|---|---|---|---|---|
Number |
Description |
Form |
|
Filing Date |
||
10.20†† |
Filed as Exhibit 10.25 to the Annual Report on Form 10-K for the year ended December 31, 2020. |
March 9, 2021 |
||||
|
||||||
10.21†† |
Filed as Exhibit 10.26 to the Annual Report on Form 10-K for the year ended December 31, 2020. |
March 9, 2021 |
||||
|
||||||
10.22†† |
Filed as Exhibit 10.27 to the Current Report on Form 8-K. |
April 15, 2021 |
||||
|
||||||
10.23†† |
Filed as Exhibit 10.27 to the Current Report on Form 8-K. |
April 19, 2021 |
||||
10.24+ |
Filed as Exhibit Annex A to Schedule 14A Definitive Proxy Statement. |
April 7, 2022 |
||||
10.25 |
Filed as Exhibit 10.1 to the Quarterly Report on Form 10-Q for the quarter ended March 31, 2022 |
May 5, 2022 |
||||
10.26+ |
Filed as Exhibit 10.30 to the Annual Report on Form 10-K for the year ended December 31, 2022 |
February 28, 2023 |
||||
10.27+ |
CLNE PlasmaFlow Holdings, LLC 2023 Equity Incentive Plan – Form of Option Award. |
Filed as Exhibit 10.31 to the Annual Report on Form 10-K for the year ended December 31, 2022 |
February 28, 2023 |
|||
10.28+ |
CLNE PlasmaFlow Holdings, LLC 2023 Equity Incentive Plan – Form of Profits Interest Award. |
Filed as Exhibit 10.32 to the Annual Report on Form 10-K for the year ended December 31, 2022 |
February 28, 2023 |
|||
117
Exhibit |
|
|
Incorporated by Reference |
|||
|---|---|---|---|---|---|---|
Number |
Description |
Form |
|
Filing Date |
||
10.29 |
Filed as Exhibit 10.1 to the Current Report on Form 8-K |
December 13, 2023 |
||||
10.30†† |
Filed as Exhibit 10.1 to the Quarterly Report on Form 10-Q for the quarter ended June 30, 2024 |
August 7, 2024 |
||||
10.31†† |
Filed as Exhibit 10.2 to the Quarterly Report on Form 10-Q for the quarter ended June 30, 2024 |
August 7, 2024 |
||||
10.32†† |
Filed as Exhibit 10.3 to the Quarterly Report on Form 10-Q for the quarter ended June 30, 2024 |
August 7, 2024 |
||||
10.33 |
Filed as Exhibit 10.2 to the Current Report on Form 8-K |
December 13, 2023 |
||||
10.34 |
Filed as Exhibit 10.4 to the Current Report on Form 8-K |
December 13, 2023 |
||||
10.35+ |
Filed as Annex A to the Proxy Statement on Schedule 14A |
April 4, 2024 |
||||
10.36+ |
Clean Energy Fuels Corp. 2024 Performance Incentive Plan - Form of Option Agreement (Director). |
Filed as Exhibit 10.5 to the Quarterly Report on Form 10-Q for the quarter ended June 30, 2024 |
August 7, 2024 |
|||
118
Exhibit |
|
|
Incorporated by Reference |
|||
|---|---|---|---|---|---|---|
Number |
Description |
Form |
|
Filing Date |
||
10.37+ |
Clean Energy Fuels Corp. 2024 Performance Incentive Plan - Form of Option Agreement (Executive). |
Filed as Exhibit 10.6 to the Quarterly Report on Form 10-Q for the quarter ended June 30, 2024 |
August 7, 2024 |
|||
10.38+ |
Clean Energy Fuels Corp. 2024 Performance Incentive Plan - Form of Option Agreement (Non-Executive). |
Filed as Exhibit 10.7 to the Quarterly Report on Form 10-Q for the quarter ended June 30, 2024 |
August 7, 2024 |
|||
10.39+ |
Clean Energy Fuels Corp. 2024 Performance Incentive Plan - Form of RSU Grant Agreement (Director). |
Filed as Exhibit 10.8 to the Quarterly Report on Form 10-Q for the quarter ended June 30, 2024 |
August 7, 2024 |
|||
10.40+ |
Clean Energy Fuels Corp. 2024 Performance Incentive Plan - Form of RSU Grant Agreement (Executive). |
Filed as Exhibit 10.9 to the Quarterly Report on Form 10-Q for the quarter ended June 30, 2024 |
August 7, 2024 |
|||
10.41+ |
Filed as Exhibit 10.10 to the Quarterly Report on Form 10-Q for the quarter ended June 30, 2024 |
August 7, 2024 |
||||
19.1* |
||||||
21.1* |
||||||
|
||||||
23.1* |
Consent of Independent Registered Public Accounting Firm KPMG LLP. |
|||||
|
||||||
24.1* |
Power of Attorney (included on the signature page to this report). |
|||||
|
||||||
31.1* |
||||||
|
||||||
31.2* |
||||||
|
||||||
119
Exhibit |
|
|
Incorporated by Reference |
|||
|---|---|---|---|---|---|---|
Number |
Description |
Form |
|
Filing Date |
||
32.1** |
||||||
97 |
Filed as Exhibit 97 to the Annual Report on Form 10-K for the year ended December 31, 2023 |
February 29, 2024 |
||||
|
||||||
101* |
The following materials from Clean Energy Fuels Corp.’s Annual Report on Form 10-K for the year ended December 31, 2024, formatted in iXBRL (Inline eXtensible Business Reporting Language): |
|||||
|
||||||
(i) Consolidated Balance Sheets; |
||||||
(ii) Consolidated Statements of Operations; |
||||||
(iii) Consolidated Statements of Comprehensive Income (Loss); |
||||||
(iv) Consolidated Statements of Stockholders’ Equity; |
||||||
(v) Consolidated Statements of Cash Flows; and |
||||||
(vi) Notes to Consolidated Financial Statements. |
||||||
104* |
Cover Page Interactive Data File (formatted as iXBRL and contained in Exhibit 101) |
|
||||
+ |
Management contract or compensatory plan or arrangement. |
† |
Portions of this exhibit have been omitted pursuant to the grant of a request for confidential treatment and the non-public information has been filed separately with the SEC. |
†† |
Certain portions of this document that constitute confidential information have been redacted in accordance with Item 601(b)(10) of Regulation S-K. |
* |
Filed herewith. |
** |
Furnished herewith. |
120
SIGNATURES
Pursuant to the requirements of Section 13 or 15(d) of the Securities Exchange Act of 1934, the registrant has duly caused this report to be signed on its behalf by the undersigned, thereunto duly authorized.
CLEAN ENERGY FUELS CORP. |
||
By: |
/s/ ANDREW J. LITTLEFAIR |
|
Andrew J. Littlefair |
||
President and Chief Executive Officer |
||
Date: February 24, 2025
POWER OF ATTORNEY
IN WITNESS WHEREOF, each person whose signature appears below constitutes and appoints Andrew J. Littlefair and Robert M. Vreeland as his true and lawful agent, proxy and attorney-in-fact, each acting alone, with full power of substitution and resubstitution, for him and in his name, place and stead, in any and all capacities, to (i) act on and sign any amendments to this report, with exhibits thereto and other documents in connection therewith, (ii) act on and sign such certificates, instruments, agreements and other documents as may be necessary or appropriate in connection therewith, and in each case file the same with the Securities and Exchange Commission, hereby approving, ratifying and confirming all that such agent, proxy and attorney-in-fact or any of his substitutes may lawfully do or cause to be done by virtue thereof.
121
Pursuant to the requirements of the Securities Exchange Act of 1934, this report has been signed below by the following persons on behalf of the registrant and in the capacities and on the dates indicated.
Signature |
|
Title |
|
Date |
/s/ ANDREW J. LITTLEFAIR |
President, Chief Executive Officer (Principal Executive Officer) and Director |
February 24, 2025 |
||
Andrew J. Littlefair |
||||
/s/ ROBERT M. VREELAND |
Chief Financial Officer (Principal Financial Officer and Principal Accounting Officer) |
February 24, 2025 |
||
Robert M. Vreeland |
||||
/s/ STEPHEN A. SCULLY |
Chairman of the Board and Director |
February 24, 2025 |
||
Stephen A. Scully |
||||
/s/ LIZABETH ARDISANA |
Director |
February 24, 2025 |
||
Lizabeth Ardisana |
||||
/s/ KARINE BOISSY-ROUSSEAU |
Director |
February 24, 2025 |
||
Karine Boissy-Rousseau |
||||
/s/ PATRICK FORD |
Director |
February 24, 2025 |
||
Patrick Ford |
||||
/s/ JAMES C. MILLER III |
Director |
February 24, 2025 |
||
James C. Miller III |
||||
/s/ KENNETH M. SOCHA |
Director |
February 24, 2025 |
||
Kenneth M. Socha |
||||
/s/ MATHIEU SOULAS |
Director |
February 24, 2025 |
||
Mathieu Soulas |
||||
/s/ VINCENT C. TAORMINA |
Director |
February 24, 2025 |
||
Vincent C. Taormina |
||||
122